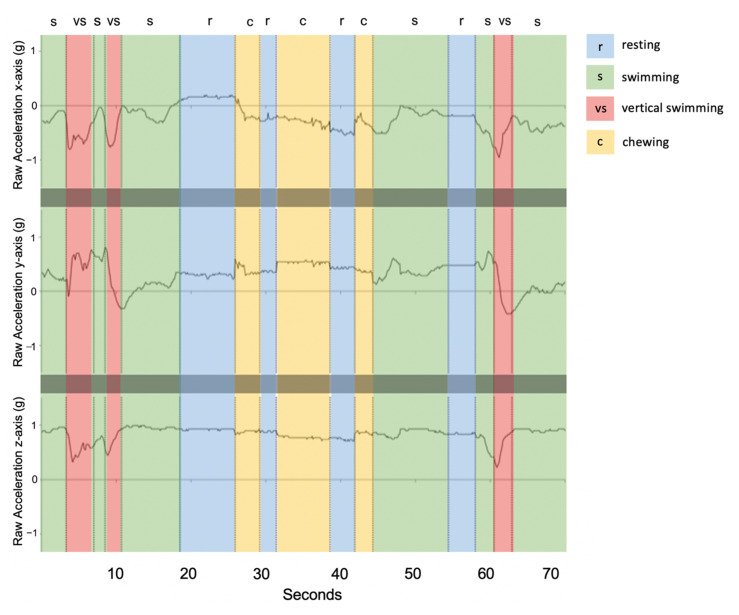
Figure 3.
Example of raw acceleration data over a 70-s time window (shark ID 5541) engaging in each of the four behaviour classes. Vertical dashed lines indicate transitions between behavioural states where r: resting (blue), s: swimming (green), vs: vertical swimming (red), and c: chewing (yellow).

