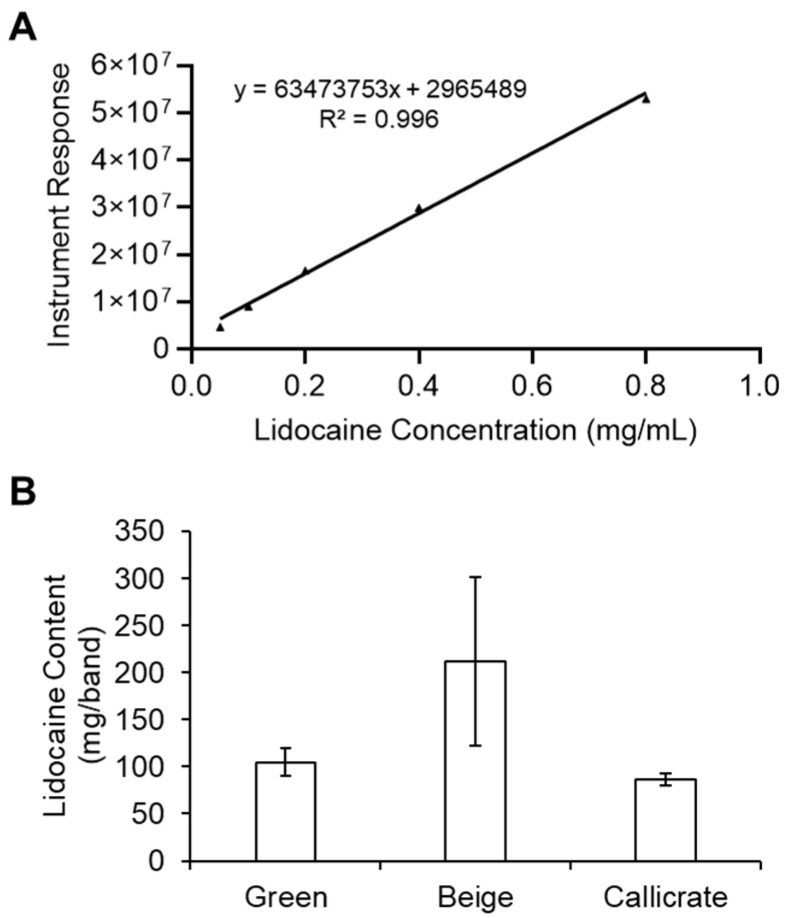
Figure 3.
Calibration curve and lidocaine quantitation by GC–MS. (A) Standard curve for various lidocaine concentrations quantified (in duplicate) by GC–MS. (B) Quantitation of lidocaine extracted from each type of lidocaine-loaded castration band (LLB). Note that, for the Callicrate bands, only a section of the band (corresponding with the surface that would contact the animal’s scrotum) was analyzed. Bars represent the mean ± standard deviation for 6 (green), 3 (beige), or 4 (Callicrate) independent replicates.

