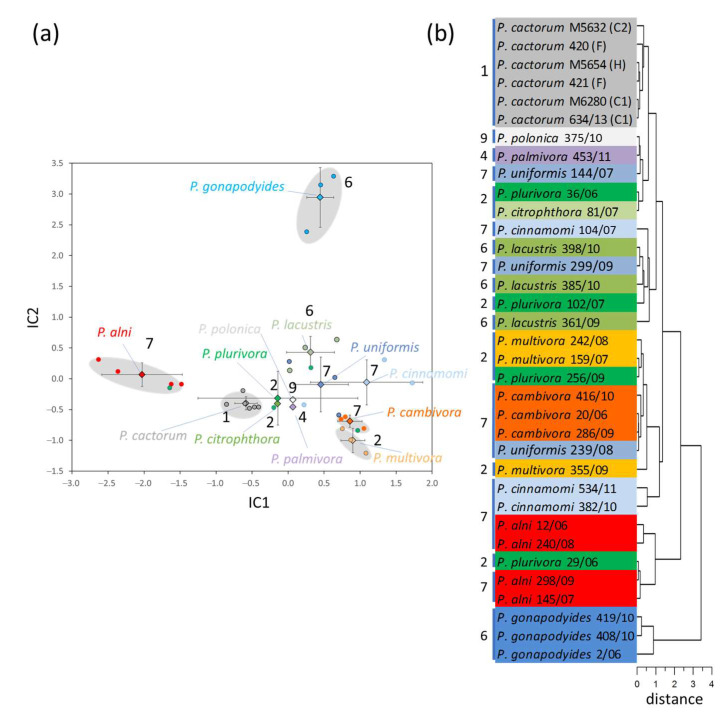
Figure 1.
Shotgun proteomics-based clustering of Phytophthora isolates. (a) Independent component analysis of 1787 MS1 peak areas (intensity threshold—0.1% of the total ion chromatogram). Circles, diamonds, error bars and the gray shading represent mean profiles of two biologically distinct samples, means, standard deviation, and significant clustering of the species (p < 0.05; Kruskal–Wallis), respectively. Numbers indicate recognized Phytophthora clades, color corresponds to the individual species; (b) Clustering analysis based on IC1 and IC2 coordinates.

