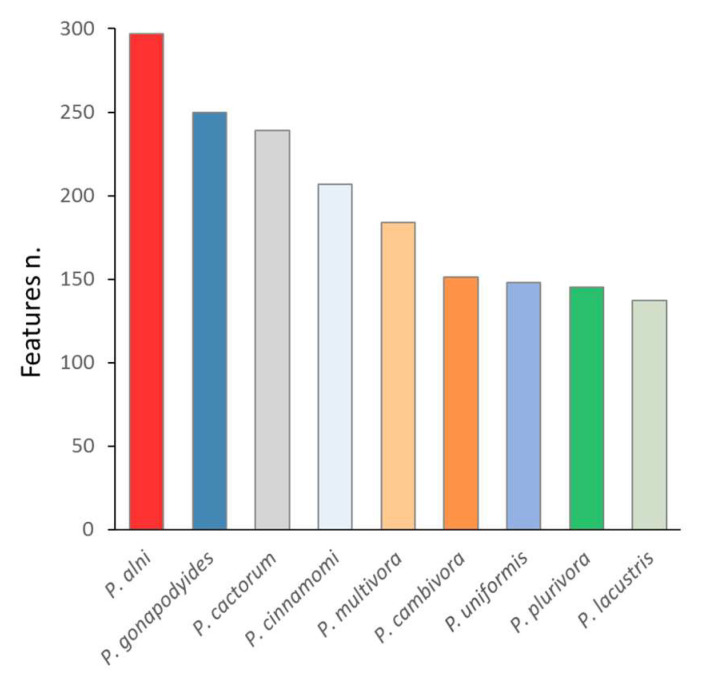
Figure 2.
Species-specific patterns found in mycelium proteomes. Number of identified features showing statistically significant differences (Kruskal–Wallis test, p < 0.05) in contrast to all other analyzed species with at least three different isolates. Color corresponds to individual species (Figure 1). See Supplementary Table S2 for details.

