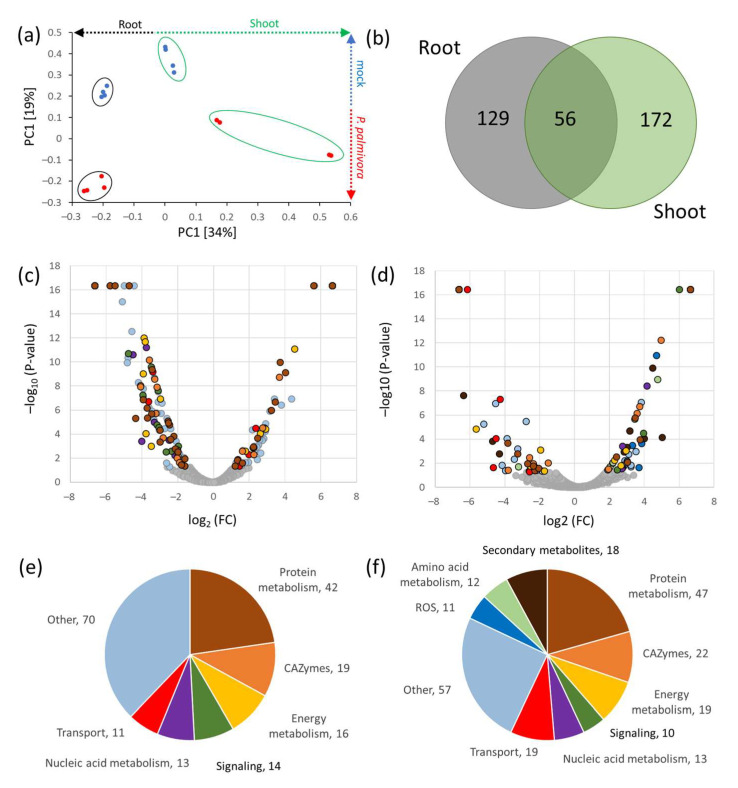
Figure 3.
Barley proteome response to P. palmivora. (a) The proteome profile separation of P. palmivora-treated and mock-treated samples. Principal component analysis based on differentially abundant proteins in shoots and roots. Results of four biological replicates represent proteins with at least two matched unique peptides. Mock-treated plants (blue) and plants inoculated with P. palmivora (red) are indicated. Circles represent statistically significant separation (Kruskal–Wallis test, p < 0.05), black and green color corresponds to root and shoot tissue, respectively. (b) The overlap between differentially abundant proteins in shoots and roots (absolute fold change FC > 1.5; p < 0.05). (c–f) Volcano plot representation and functions of P. palmivora response proteins in barley roots (c,d) and shoots (d,f). Only categories represented by more than nine proteins are highlighted. The color of spots representing differentially abundant proteins in panels (c,d) corresponds to categories highlighted in (e,f).

