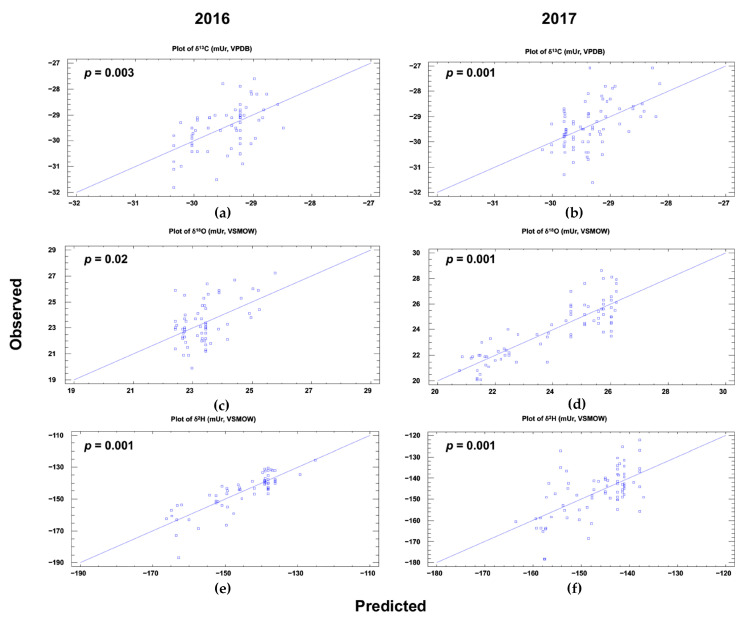
Figure 4.
Observed vs. predicted values for carbon, oxygen and hydrogen isotopic composition in two harvest years (2016 and 2017) calculated by multiple linear regression (MLR) using geoclimatic parameters of VOO producer areas as predictors. (a,b) plots of δ13C from 2016 and 2017; (c,d) plots of δ18O from 2016 and 2017; (e,f) plots of δ2H from 2016 and 2017.

