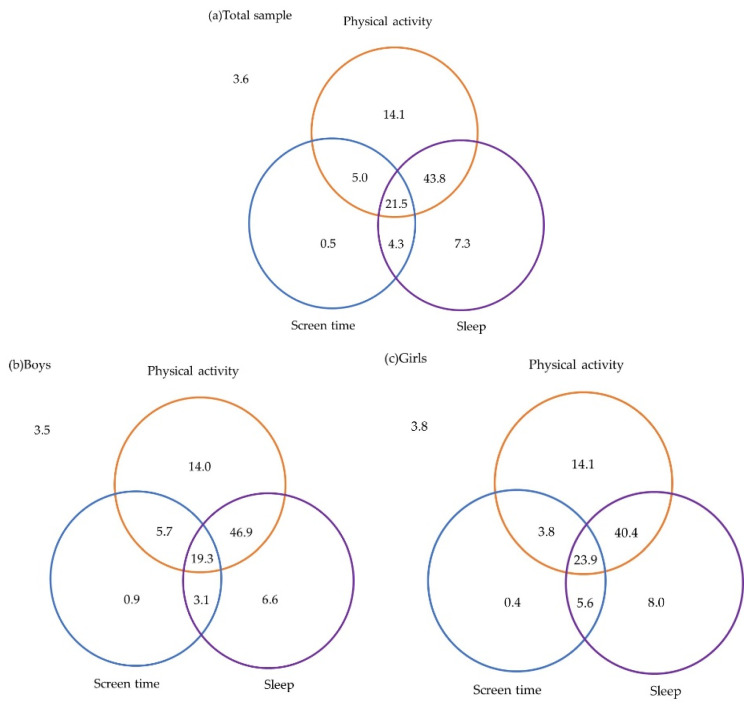
Figure 1.
Percentages meeting 24-h movement guidelines among (a) overall (n = 421), (b) boys (n = 216) and (c) girls (n = 199) Japanese preschool children. Venn diagram: The numbers within each circle are added to the proportion of children meeting each individual guideline (i.e., 65.4% for physical activity, 88.2% for screen time and 29.5% for sleep duration). The total nonoverlap area of each circle represents the proportion of children meeting one of the three guidelines (i.e., 6.0% + 18.9% + 1.6% = 26.5%). The total overlap areas of two circles represents the proportion of children meeting two guidelines of the three guidelines (i.e., 42.9% + 1.5% + 11.4% = 55.8%). The overlap area of three circles represents the proportion of children meeting all three guidelines (i.e., 15.0%). The outside area of the circle represents the proportion of children not meeting any of the guidelines (i.e., 2.7%).

