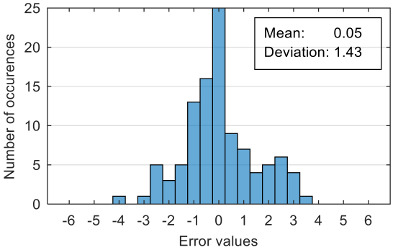
Table 9.
Distribution of estimation errors and confusion matrices for levels 2 and 3—using four features.

|
Real | Low | 0.95 | 0.05 | 0.00 | ||||
| Real | Low | 0.99 | 0.01 | Mild | 0.18 | 0.76 | 0.16 | ||
| High | 0.12 | 0.88 | High | 0.00 | 0.30 | 0.70 | |||
| Low | High | Low | Mild | High | |||||
| Estimated | Estimated | ||||||||
| Accuracy: 97.14% | Accuracy: 89.53% | ||||||||
