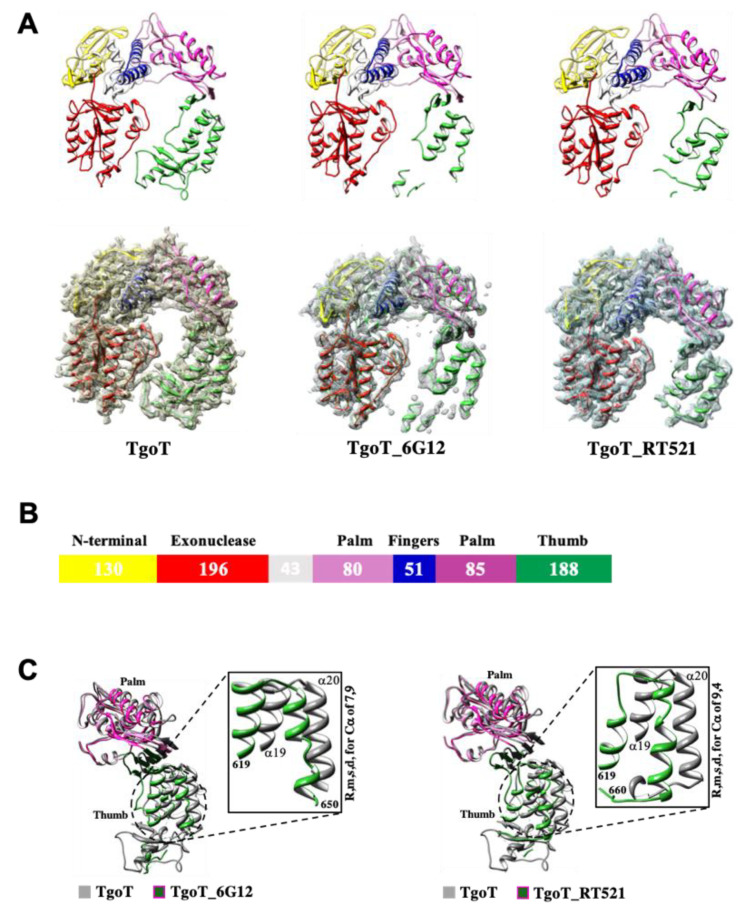
Figure 1.
Structural comparison between TgoT apo form and its two variants, TgoT_6G12 and TgoT_RT521. (A) Cartoon representation of TgoT, TgoT_6G12, and TgoT_RT521 polymerases with a colored representation of domains (Upper panel). The domains are colored as follows: N-terminal domain (yellow), 3′-5′ exonuclease domain (red), palm domain (light and dark magenta for its N-terminal and C-terminal parts, respectively), fingers domain (blue), and thumb domain (green). An interhelical segment between the exonuclease and the palm domains is colored in light grey. The 2Fo–Fc X-ray electron density omit map is shown and contoured at a level of 1 σ (Down panel) as a grey mesh to illustrate the less ordered character of the thumb domain (green). (B) Domain organization in Tgo polB. Conserved domains are represented as colored boxes and their length is indicated. A non-conserved inter-helical segment is colored in light grey. (C) Overlay of the palm (light and dark magenta) and the thumb (green) domains of TgoT variants with the palm and thumb domains (grey) of TgoT. Broader movements observed in the thumb domains are highlighted with a zoom on helices S and T (r.m.s. deviation for Cα of 7.9 Å for TgoT_6G12 and 9.4 Å for TgoT_RT521).

