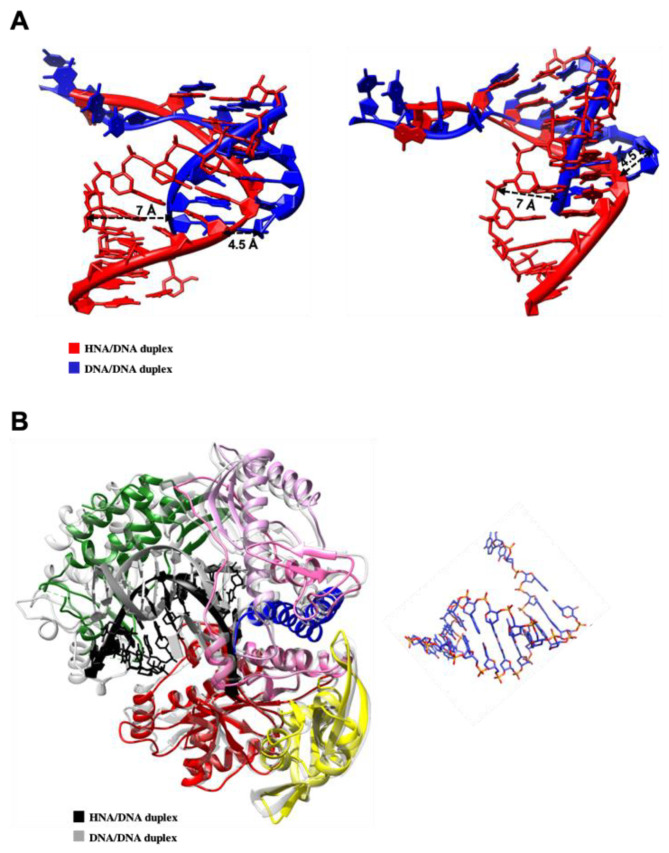
Figure 5.
Comparison between a natural DNA-DNA duplex and a HNA-DNA duplex bound to Tgo_6G12. (A) Overlay of the HNA-DNA primer-template duplex (in red) with the natural DNA-DNA duplex (in blue), in two different orientations (left and right panels). Deviation between the two duplexes is labeled with dash lines. (B) On the left, superimposition of our X-ray ternary structure solved with a DNA/DNA duplex (colored by domains) with the in silico ternary structure modeled and equilibrated in the presence of an HNA/DNA duplex (in light grey). The DNA/DNA duplex is labeled in grey whereas the HNA/DNA duplex is labeled in black. On the right is represented the HNA/DNA duplex as stick, at the same scale.

