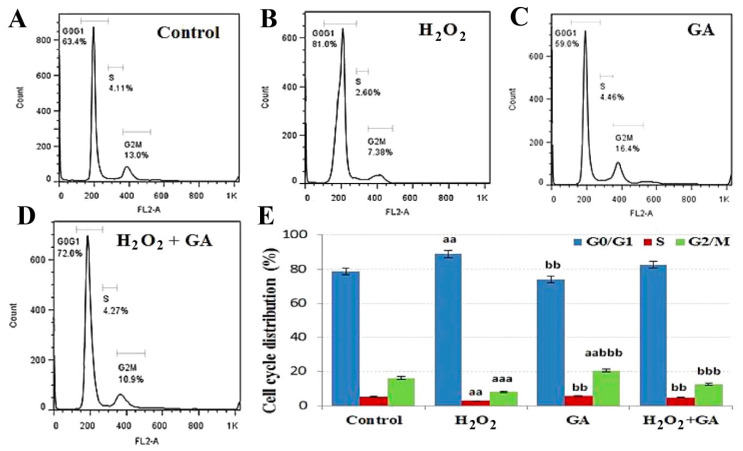
Figure 3.
Cell cycle distribution is shown in the presence of control (A), H2O2 (B), gallic acid (GA) (C), and H2O2 + GA (D). The percentage of cells in different phases is shown in graph (E). Data are presented as the mean ± standard error of measurements performed on six groups, with three independent replicates. Significant difference from control (aa p < 0.01, aaa p < 0.001), significant difference from H2O2 (bb p < 0.01, bbb p < 0.001).

