Figure 2.
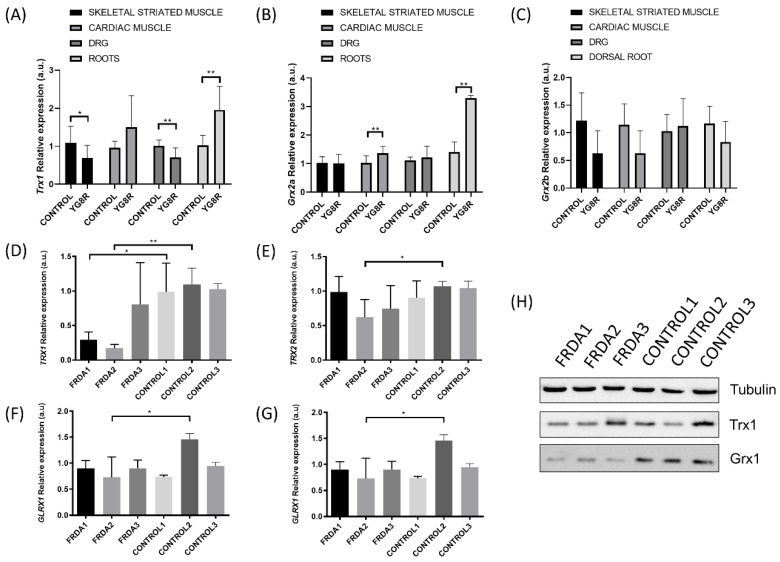
Changes in the levels of Trx and Glrxs expression in mice and human fibroblast Friedreich’s ataxia (FRDA) models. The relative mRNA expression of Trx1 (A), Glrx2 isoform a (B), and Glrx2 isoform b (C) was determined in skeletal striated muscle, cardiac muscle, dorsal root ganglia (DRG), and nerve roots of a C56B6LJ control mouse (n = 3) and YG8R frataxin-deficient mouse model (n = 3). The relative mRNA expression of TRX1 (D), TRX2 (E), GLRX1 (F) and GLRX2 (G) was analyzed in fibroblasts from FRDA patients (n = 3) and healthy subjects (n = 3). The relative mRNA expression levels were calculated using Glyceraldehyde-3-Phosphate Dehydrogenase (GAPDH) as an endogenous control. (H) Western blot analysis of protein levels for TRX1 and GLRX1 in fibroblasts from FRDA patients and healthy subjects. Statistical significance refers to the values for the CONTROL samples for each tissue (* p < 0.05, ** p < 0.01). Methodology is described in Supplementary Materials.

