Figure 3.
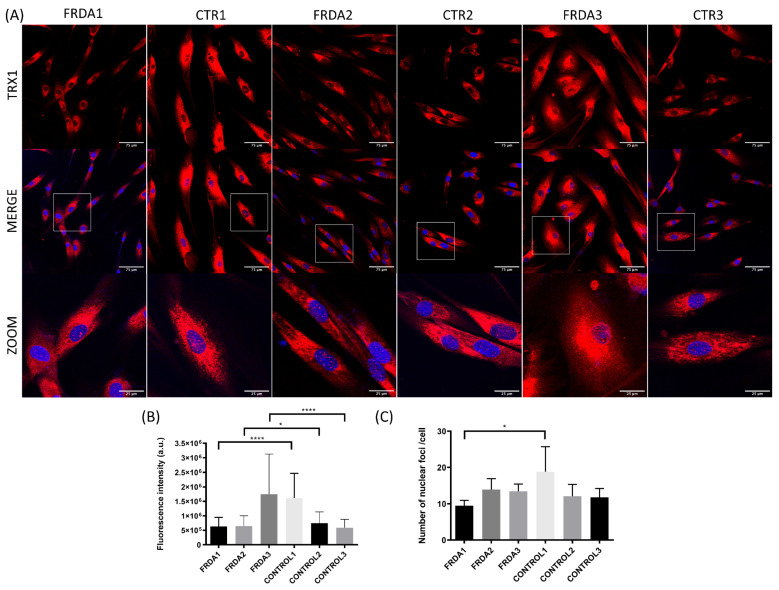
Subcellular localization of TRX1 in fibroblasts from FRDA patients (FRDA1, FRDA2, and Figure 3. n = 3) and from matched healthy subjects (CTR1, CTR2, and CTR3; n = 3). (A) Representative images of fibroblasts stained with anti-TRX1 antibody from each patient and healthy subject. Confocal images show the maximal intensity projection. The images were used to determine the subcellular localization of TRX1 (red). The nuclei were stained with Hoechst (blue), and zooms show the colocalization nuclear region. (B) Quantification of relative fluorescence intensity of TRX1 from confocal images in each cell line of fibroblasts from FRDA patients and controls. Fluorescence intensity was measured for each cell in at least three different images of each cell line using ImageJ software. The Mann–Whitney test was used to compare each patient with its paired control to obtain statistical significance. (C) Quantification of the number of nuclear foci of TRX1 per cell. The total number of nuclear foci was measured in cells with the entire nuclei and was normalized by the number of total cells. At least three different images of each cell line were measured using ImageJ software. The Mann–Whitney test was used to compare each patient with a control to obtain statistical significance. The statistical analyses were performed using Graphpad prism 8.0 software. Statistical significance refers to the values for the matched healthy subject for each FRDA patient (* p < 0.05, **** p < 0.0001). Methodology is described in Supplementary Materials.

