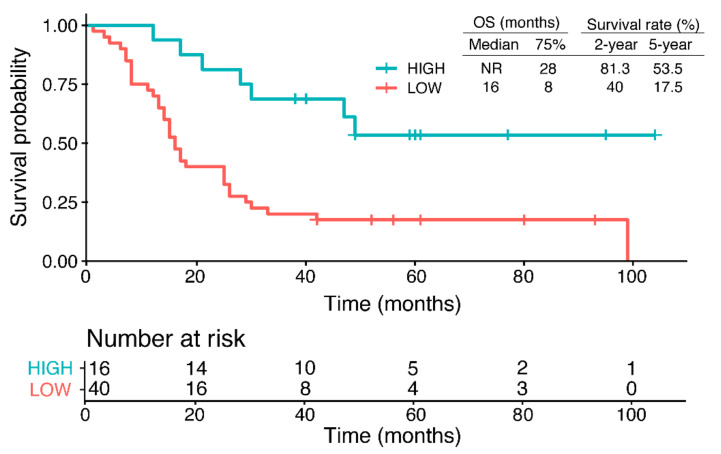
Figure 2.
Overall survival (OS) according to the expression levels of RPRML in GC. Kaplan–Meier curves show the OS probability of patients with high versus low RPRML expression (cut-off IHC score = 0.162) among 56 advanced GC cases (TNM Stage III and IV). The median and 75% percentile OS times and 2- and 5-year survival rates are shown. The bottom panel shows the number of patients at risk.

