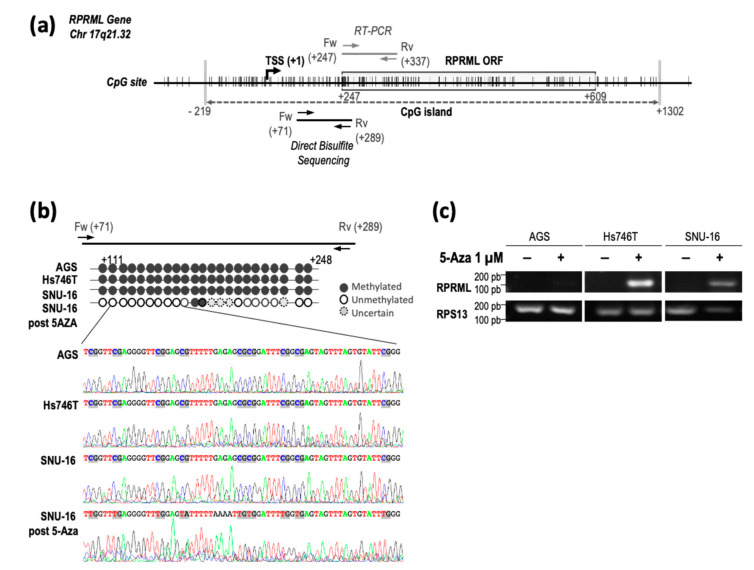
Figure 3.
RPRML gene structure, methylation status, and transcript expression in GC cell lines after the 5-azacytidine (5-Aza) assay. (a) Schematic representation of RPRML gene structure, open reading frame (ORF), and CpG sites (vertical lines). A dense CpG island is depicted by a gray dashed arrow between nucleotides −219 and +1302 relative to the transcription start site (TSS). The region analyzed within the RPRML gene by direct bisulfite sequencing is located between nucleotides +71 to +289 relative to the TSS. RT-PCR primers are located between nucleotides +247 and +337. (b) Schematic representation and electropherograms of direct bisulfite sequencing results in the three GC cell lines. Individual CpG methylation status is represented by black (methylated) and white (unmethylated) circles. The bottom panel shows the result of direct bisulfite sequencing after treatment with 1 μM 5-Aza. (c) Re-expression of RPRML transcripts after treatment with 1 μM 5-Aza in three endogenously silent GC cell lines (AGS, Hs746T, SNU-16).

