Figure 4.
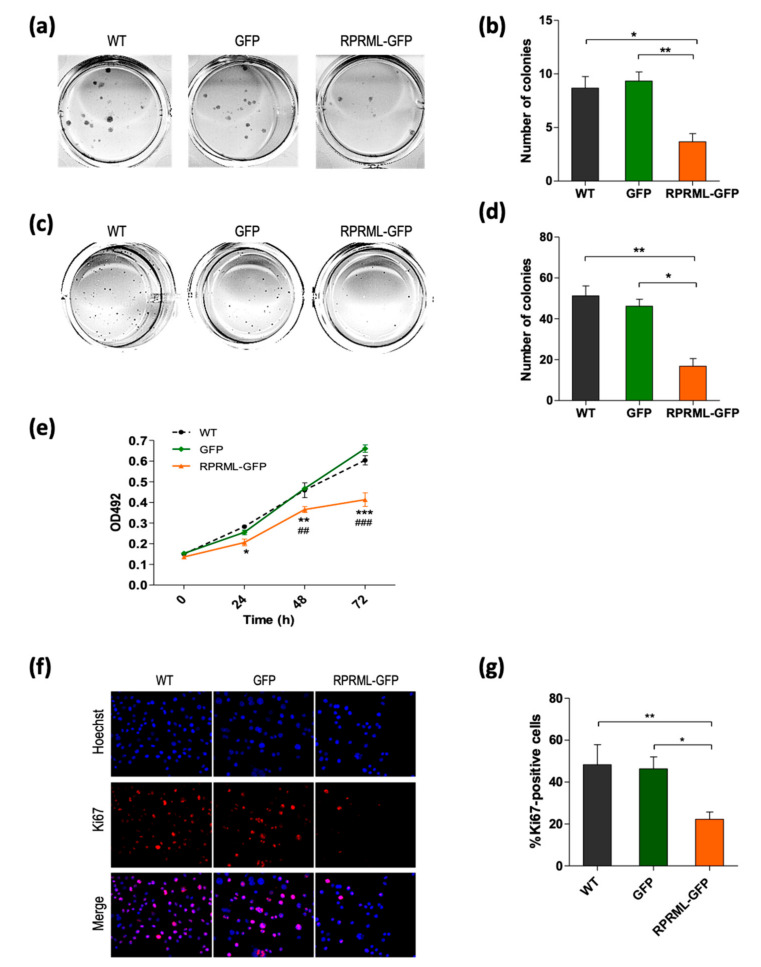
RPRML overexpression inhibits clonogenic capacity, anchorage-independent growth, and proliferation. (a) Representative image of a colony formation assay in wild type (WT), GFP-, and RPRML-GFP–overexpressing AGS cells. (b) Quantification of colony formation assay. The results are the mean number of colonies of three independent assays and the standard error of the mean (SEM) (bars). Statistical analysis: Kruskal-Wallis test (p = 0.007) followed by Dunn’s multiple comparison test (** p < 0.01, * p < 0.05). (c) Representative images of soft agar colony formation assay in WT, GFP-, or RPRML-GFP–overexpressing cells. (d) Quantification of soft agar colony formation assay. Colonies > 50 μm were counted. The results are the mean number of colonies of three independent assays and the SEM (bars). Statistical analysis: Kruskal-Wallis test (p = 0.001) followed by Dunn’s multiple comparison test (** p < 0.01, * p < 0.05). (e) Cell proliferation of WT, GFP-, and RPRML-GFP–expressing AGS cells was evaluated by MTS assay at 0 h, 24 h, 48 h, and 72 h (n = 3). Differences at each time point were evaluated by two-way repeated-measures ANOVA and a post hoc Bonferroni test. * WT vs. RPRML-GFP, # GFP vs. RPRML-GFP. p < 0.05 (*), p < 0.01 (**, ##), p < 0.0001 (***, ###). (f) Representative images of Ki67 immunofluorescence (red) and Hoechst staining (blue) in WT, GFP-, and RPRML-GFP–overexpressing AGS cells. (g) Percentage of Ki67-positive cells. Five random fields at ×10 magnification were quantified using ImageJ. Results represent the means of three independent experiments; bars indicate SEM. Differences between conditions were analyzed using the Kruskal-Wallis test followed by Dunn’s multiple comparison test (** p < 0.01, * p < 0.05).

