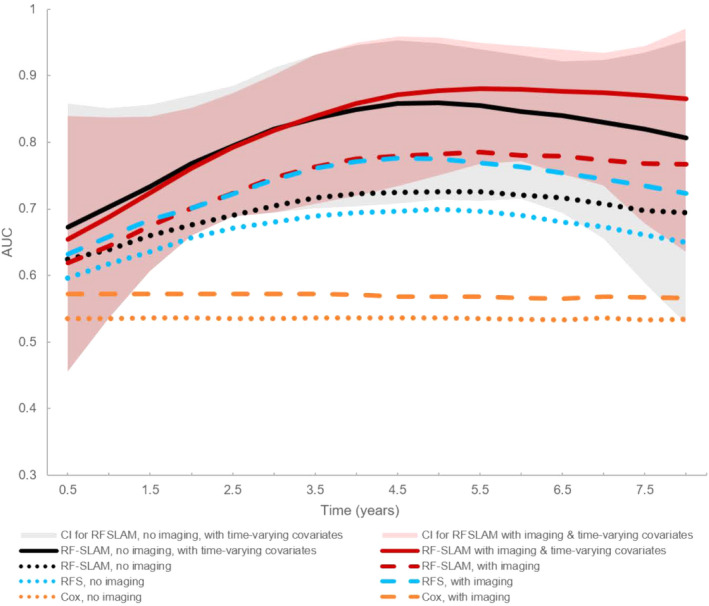
Figure 1. Median area under the curve (AUC) performances for predicting the primary end point for each of the 8 models.

Models incorporating only baseline covariates are shown as dotted or dashed lines. The 95% CIs for the AUCs over time for random forest statistical method for survival, longitudinal, and multivariable outcomes (RF‐SLAM) incorporating time‐varying covariates with (pink shaded area) and without (gray shaded area) imaging are also shown. RF‐SLAM with both imaging and time‐varying covariates (dark red solid line) had the highest AUC. RFS indicates random forest survival method.
