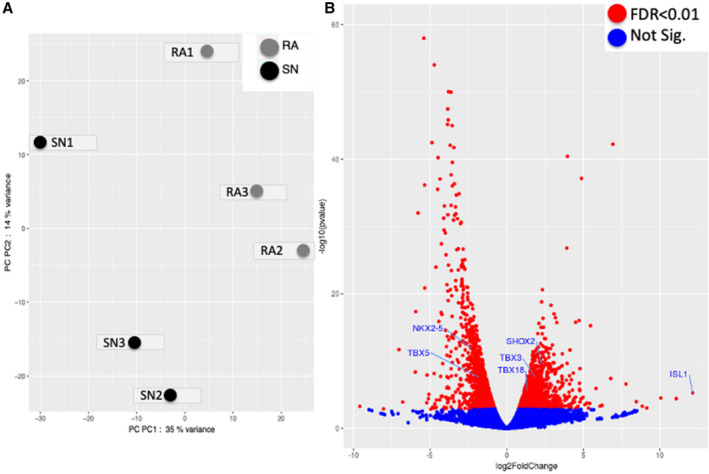
Figure 5. Next generation sequencing for RNAseq data of 3 human sinus node and 3 right atria specimens from the same hearts.

A, Principal component (PC) analysis scatter‐plot of RNAseq data from 3 human sinus node (SN) (black dots) and 3 right atrium (RA) (grey dots) specimens. The graph shows that there are 2 distinct groups of tissue, namely the SN (SN1 to SN3 cluster close on the left of x‐axis) and RA (RA1 to RA3 cluster closer close on the right of x‐axis), that have significant differential gene expression. B, Volcano plot of all RNAseq data with 6 “embryonic” transcription factors annotated on the plot. Log2FoldChange P≤0 indicates genes less expressed in the SN vs RA and vice versa. RA indicates right atrium; and SN, sinus node. Significantly more/less expressed genes (illustrated in red) based on false discover rate <0.01. FDR indicates false discovery rate; RA, right atrium; and sinus node.
