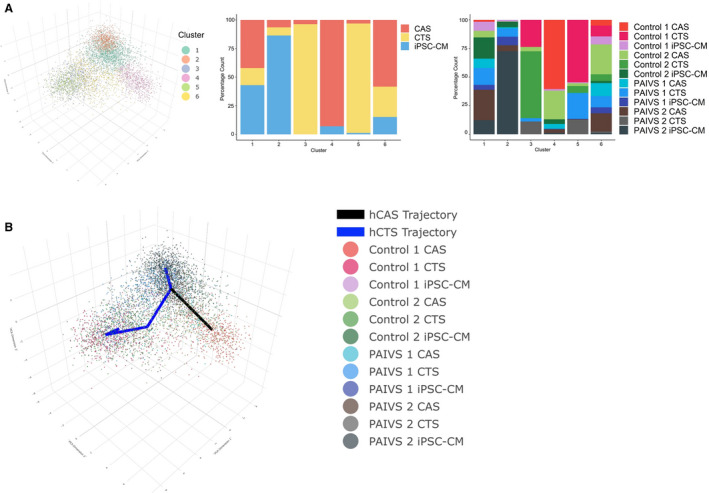
Figure 1. Model‐based clustering and pseudotime inference of combined hiPSC‐CM, hCAS, and hCTS data set reveal 2 separate trajectories for hCAS and hCTS.

A, Left: Three‐dimensional principal component analysis (PCA) plot illustrating 6 cell clusters identified by model‐based clustering, Middle: Histogram illustrating the percentage proportion of cardiomyocyte populations from each cluster. Right: Histogram illustrating the percentage proportion of cardiomyocyte populations of each cell line from each cluster. B, Three‐dimensional PCA plot illustrating 2 pseudotime trajectories starting from hiPSC‐CM cluster to hCAS (black) to hCTS (blue) clusters. hCAS indicates human cardiac anisotropic sheet; hCTS, human cardiac tissue strip; hiPSC‐CM, human‐induced pluripotent stem cell–derived cardiomyocytes; and PAIVS, pulmonary atresia with intact ventricular septum.
