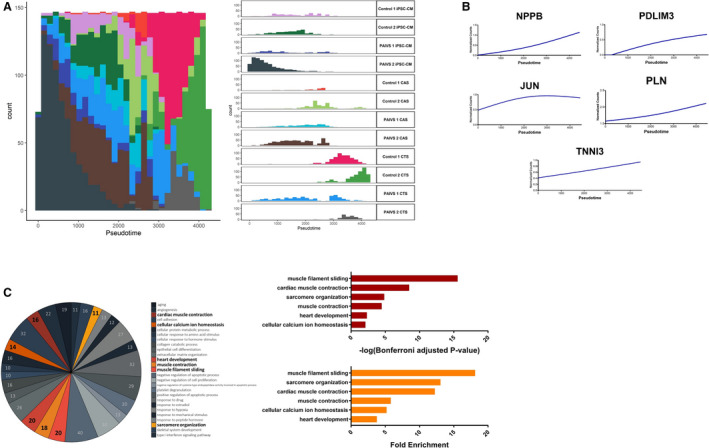
Figure 3. Pseudotime analysis reveals promaturational effects on cardiac contraction and calcium handling in hCTS platform.

A, Histogram illustrating the distribution of cardiomyocyte populations ordered along the hCTS trajectory from beginning to end: hiPSC‐CMs—hCAS—hCTS with no discernible differences in ordering between healthy and PAIVS cardiomyocytes, Left: Aggregate plot of counts of cardiomyocytes vs pseudotime, Right: Plots separated into distinct cardiomyocyte populations from each cell line. B, Increased expression of cardiac maturation and calcium handling gene expression along the hCTS trajectory ordering of cardiomyocytes. C, Enriched GO terms of DEGs governing the hCTS trajectory, Left: Number of genes enriched for each GO term, Middle: Statistical significance, Right: Fold enrichment. DEGs indicates differential expressed genes; GO, gene ontology; hCAS, human cardiac anisotropic sheet; hCTS, human cardiac tissue strip; hiPSC‐CM, human‐induced pluripotent stem cell–derived cardiomyocytes; and PAIVS, pulmonary atresia with intact ventricular septum.
