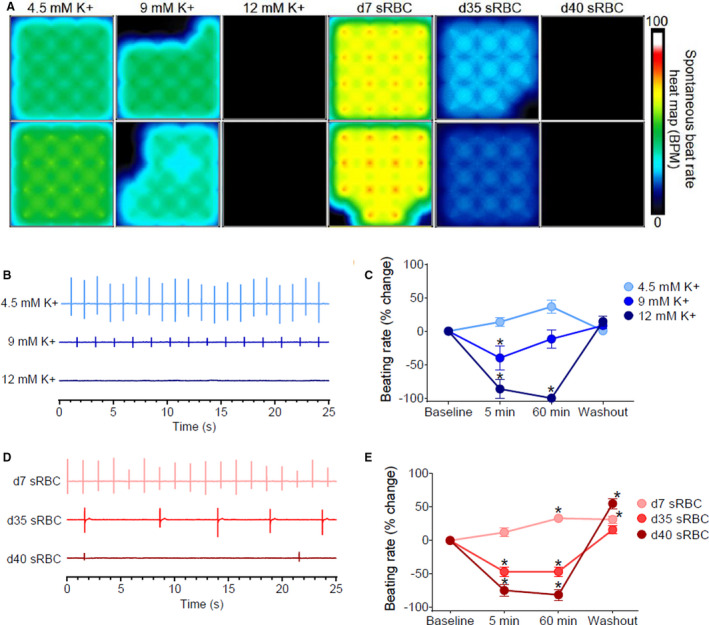
Figure 7. Reduced automaticity in hiPSC‐CM.

A, Microelectrode array heat map shows 16‐electrode recordings from hiPSC‐CM treated with control media (4.5 mM K+), media with increasing potassium concentrations (9–12 mM K+), or 10% sRBC collected from RBC units aged 7–40 days. The heat map corresponds to the spontaneous beating rate. B, Biosignals recorded from hiPSC‐CM show a decline in beating rate with elevated potassium concentrations. C, Percent change in beating rate following treatment with elevated potassium concentrations, compared with baseline. D, Biosignals show a decline in the beating rate with “older” sRBC samples (day 35–40) but not “fresh” sRBC samples (day 7). E, Percent change in beating rate following sRBC treatment, compared with baseline. Mean±SEM, n=12–24, *Significantly different from baseline, P<0.05. BPM indicates beats per minute; hiPSC‐CM, human induced pluripotent stem cell–derived cardiomyocytes; RBC, red blood cell; and sRBC, supernatant from red blood cell units.
