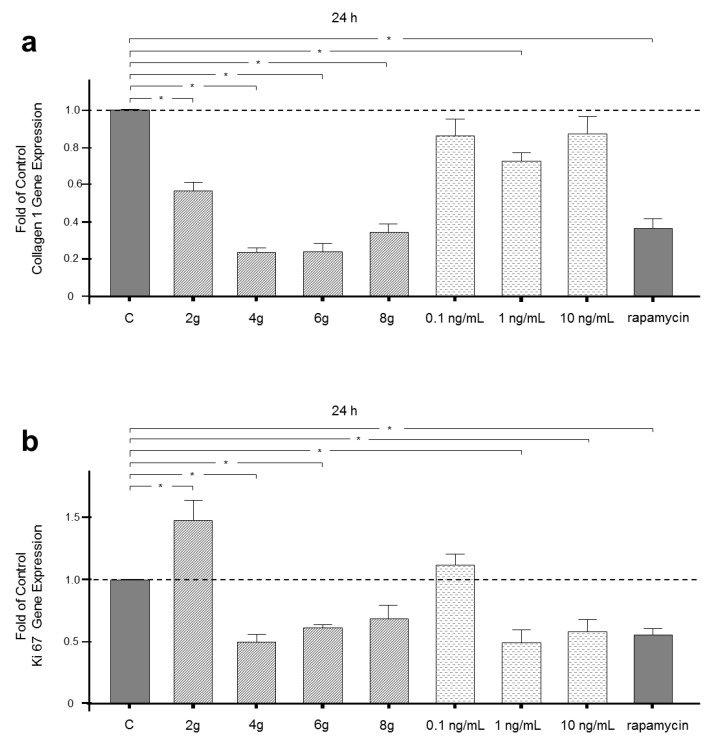
Figure 2.
(a) Effects of 2, 4, 6 or 8 g/cm2 pressure or 0.1, 1.0 or 10 ng/mL IL-1β on collagen I gene expression after 24 h. Untreated cells served as controls. Rapamycin treatment inhibited mTORC1 as the negative control. (b) Effects of 2, 4, 6 or 8 g/cm2 pressure or 0.1, 1.0 or 10 ng/mL IL-1β on Ki67 gene expression after 24 h. Untreated cells served as controls. Rapamycin treatment inhibited mTORC1 as the negative control. Mean ± SEM (n = 9 replicates); * significant (p < 0.05) difference between groups.

