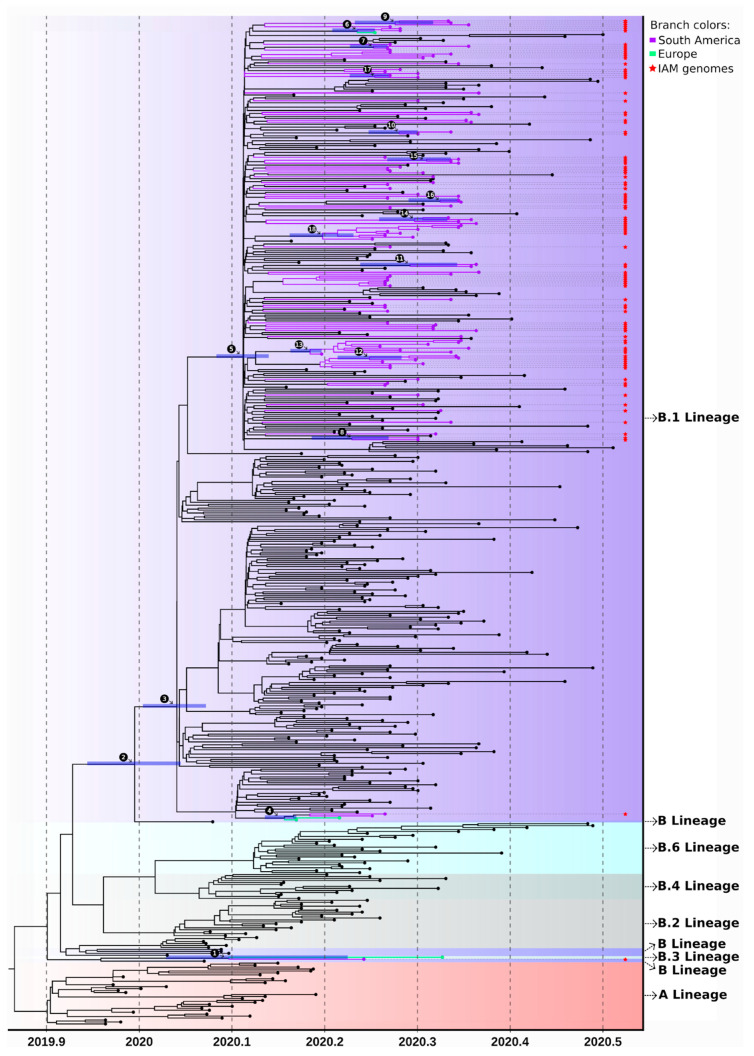
Figure 4.
Time-resolved tree reconstructed with a Bayesian framework. Numbers above the branches are specific clades showing posterior probability higher than 70 depicted in Table S2 and horizontal bar represents the HPD95% credible interval of the estimated tMRCA. Branch colors follow continent order as in Figure 3, but only highly supported clades containing genomes obtained in this study were colored. Red stars show the SARS-CoV-2 genomes from Pernambuco state.

