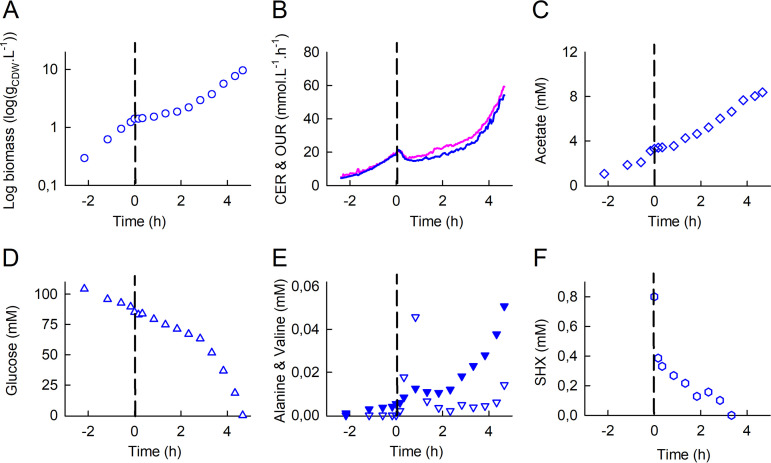
FIG 1.
Dynamics of the response of E. coli K-12 MG1655 to SHX addition during exponential growth in a bioreactor: time evolutions of biomass (A), the oxygen uptake rate (OUR) (pink) and the carbon dioxide evolution rate (CER) (blue) (B), the acetate concentration (C), the glucose concentration (D), alanine (downward triangles) and valine (filled downward triangles) concentrations (E), and the SHX concentration (F). Time zero was defined as the moment when SHX (0.8 mM) was added to the bioreactor. The OUR and CER were determined from online measurements of O2, CO2, and N2 percentages as described in Materials and Methods. Biomass and extracellular metabolite concentrations were measured in culture samples collected every 10 min to 1 h. The data are highly reproducible (see Fig. S1 in the supplemental material).

