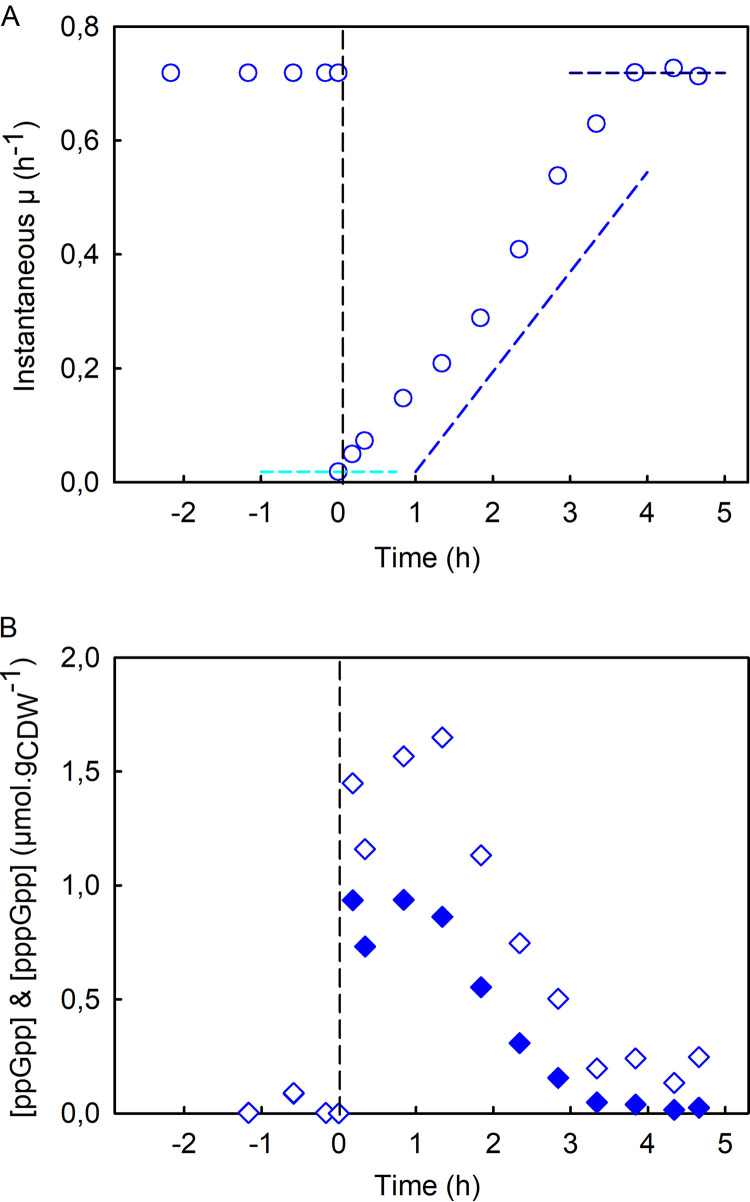
FIG 2.
Resilience of E. coli K-12 MG1655 to growth disruption. (A) Instantaneous growth rate, μ(t) (blue circles), as a function of time before and after SHX addition. The cyan dashed line indicates the robustness parameter, the slope of the blue dashed line is the recovery rate, and the dark blue dashed line represents the recovered steady state. The values of these parameters are given in Table 1. (B) Intracellular concentrations of ppGpp (diamonds) and pppGpp (filled diamonds) (micromoles per gram of cell dry weight) before and after the addition of SHX. The data are highly reproducible (see Fig. S3 in the supplemental material).

