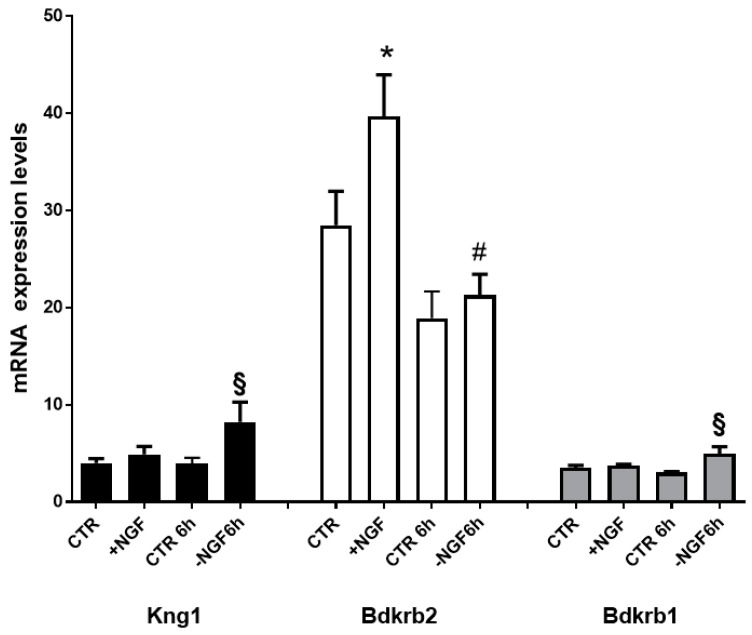
Figure 1.
mRNA expression profiles of BK and its receptors genes after NGF treatment, deprivation, and rescue. Transcript levels of genes encoding BK (Kng1; NM_012696), Bradykinin receptor 2 (Bdkrb2; NM_001270713), and Bradykinin receptor 1 (Bdkrb1; NM_030851) in cortical neurons (CNs) following 48 h NGF treatment (+NGF), induction of apoptosis by 6 h NGF deprivation (−NGF 6 h), and rescue by 6 h NGF replacement (+NGF 6 h). Data represent means (±S.E.M.) from four replicates. Statistically significant differences were calculated by one-way analysis of variance (ANOVA) followed by Bonferroni’s test for multiple comparison (* p < 0.001 vs CTR; § p < 0.05 vs CTR 6 h; # p < 0.05 vs. +NGF replacement (+NGF).

