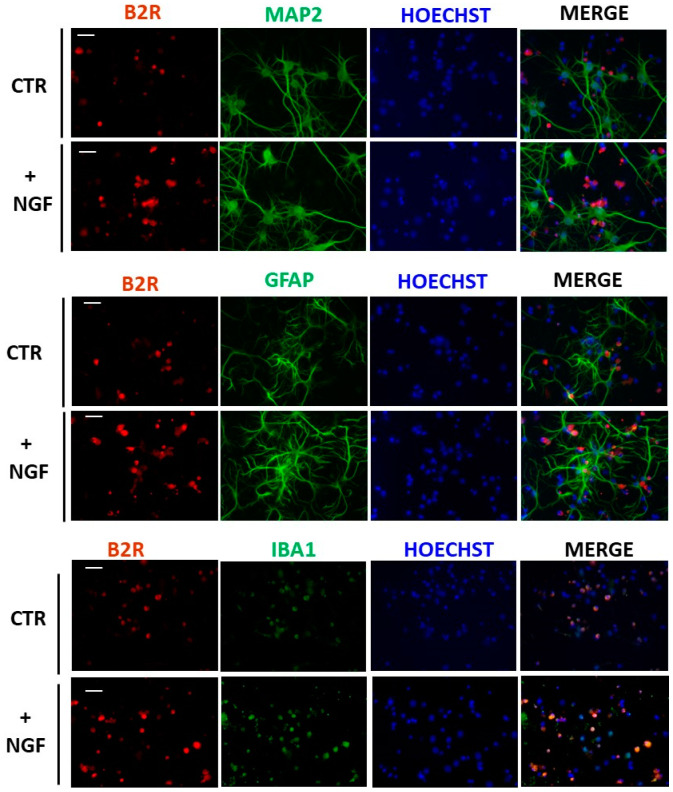
Figure 3.
Expression of B2R in mixed cortical cultures. Representative immunofluorescence images of cultured CNs stained with antibodies for B2R (red), neurons (MAP2, green), astrocytes (GFAP, green), or microglial cells (Iba1, green) and nuclei (Hoechts, blue) in control conditions (CTR) and after NGF treatment (+NGF). B2R immunoreactivity significantly increased in microglial cell body after NGF treatment. Scale bar: 15 µm.

