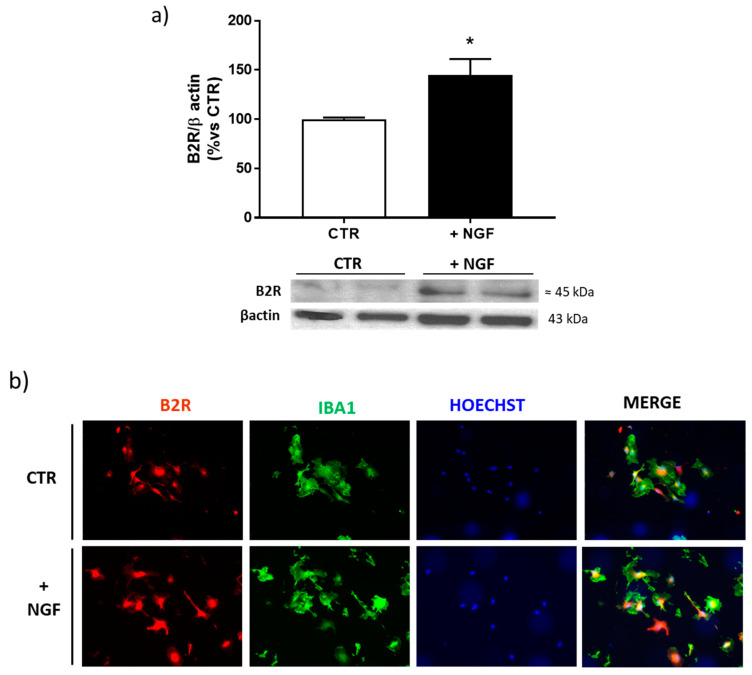
Figure 4.
Expression of bradykinin receptor 2 (B2R) after NGF treatment in cortical microglial cells. (a) Western blot analysis of B2R protein expression in enriched microglial cells cultures treated for 48 h with NGF 100 ng/mL (+NGF), normalized against β-actin, and expressed as a percentage of the control (CTR). Data represent means (±S.E.M.) from four independent experiments run in duplicate. Statistically significant differences were calculated by one-way analysis of variance (ANOVA) followed by Bonferroni’s test for multiple comparisons (* p < 0.05). (b) Representative immunofluorescence images of microglial cells stained with antibodies for B2R (red) or microglia (Iba1, green) and nuclei (Hoechts, blue) in control conditions (CTR) and after NGF treatment (+NGF). Scale bar: 15 µm.

