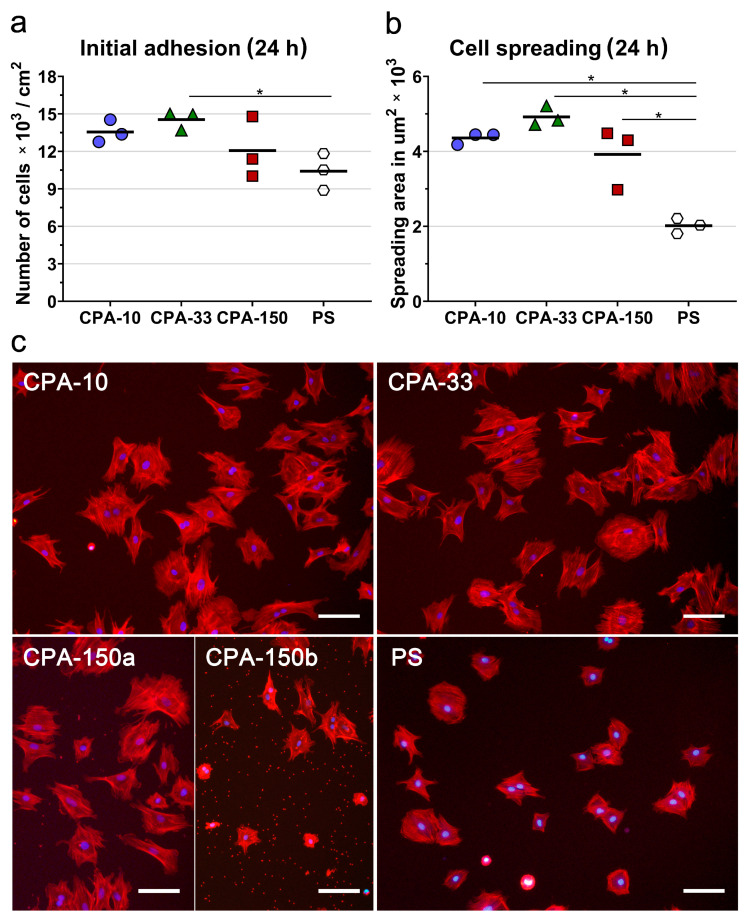
Figure 4.
Initial adhesion of VSMCs on PS culture dishes coated with PP films deposited at the average RF power (Pav) of 10, 33, and 150 W (labelled as CPA-10, CPA-33, and CPA-150, respectively): (a) number of adhered cells, (b) cell spreading areas, and (c) cell morphology 24 h after seeding. (a,b) The dots represent individual biological samples. Each dot depicts the arithmetic mean calculated (a) from cell numbers obtained from 15 pictures per each biological sample or (b) from spreading areas of a minimum of 120 cells per each biological sample. The bold central lines show the arithmetic mean of biological samples. Statistically significant differences (p ≤ 0.05) are marked by horizontal lines with asterisks connecting the differing samples. (c) Microphotographs were taken by an epifluorescence Olympus IX-71 microscope. Cell nuclei are visualized by Hoechst #33258 (blue), while the cell membrane and the actin cytoskeleton are visualized by Phalloidin-TRITC (red). The scale bar depicts 100 µm.

