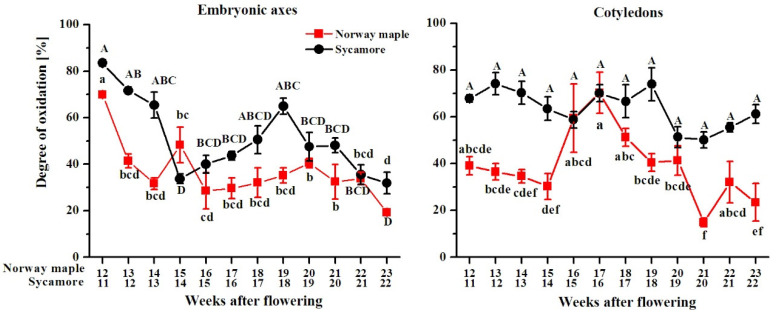
Figure 13.
Changes in the degree of oxidation of glutathione in the embryonic axes and cotyledons of developing seeds of Norway maple (squares) and sycamore (circles) collected during the 11th–23rd weeks after flowering. Data are the means of three independent replicates ± the standard error. Statistically significant differences are indicated with different letters (one-way ANOVA, followed by Tukey’s test at p < 0.05). The capital letters refer to sycamore.

