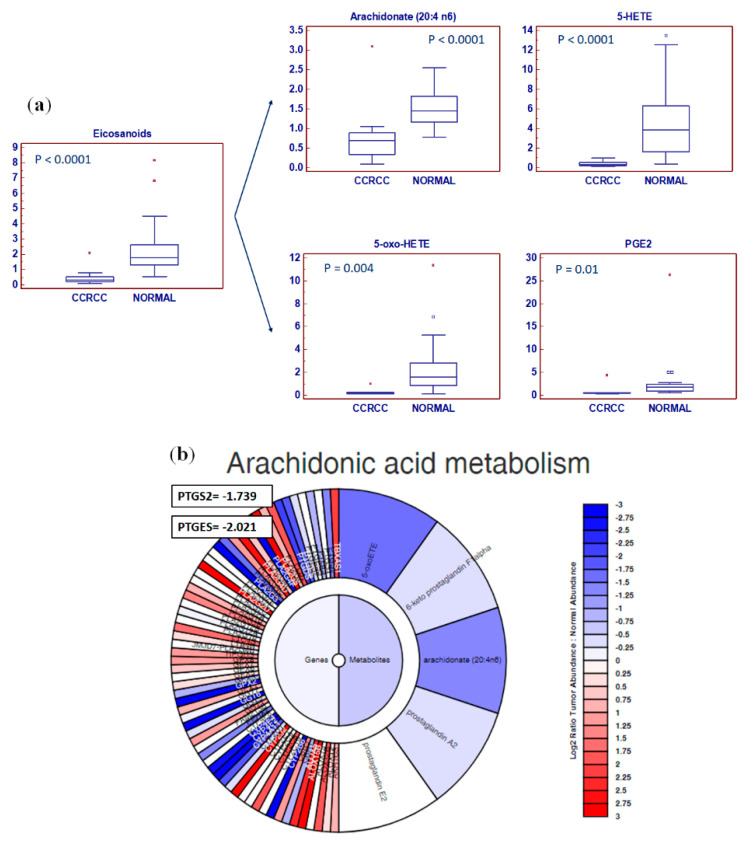
Figure 4.
The tissue levels of eicosanoids were reduced in tumor samples (ccRCC) compared to normal kidney (a). Exploration of the “Metabologram” Data Portal. The changes in the “Arachidonic acid metabolism” pathway are shown in both transcripts and metabolites when comparing tumors to adjacent normal kidney tissues (b). Y-axis: metabolite relative amount. Small squares indicate outlier in box-and-whisker plots. Solid square indicates extreme outlier.

