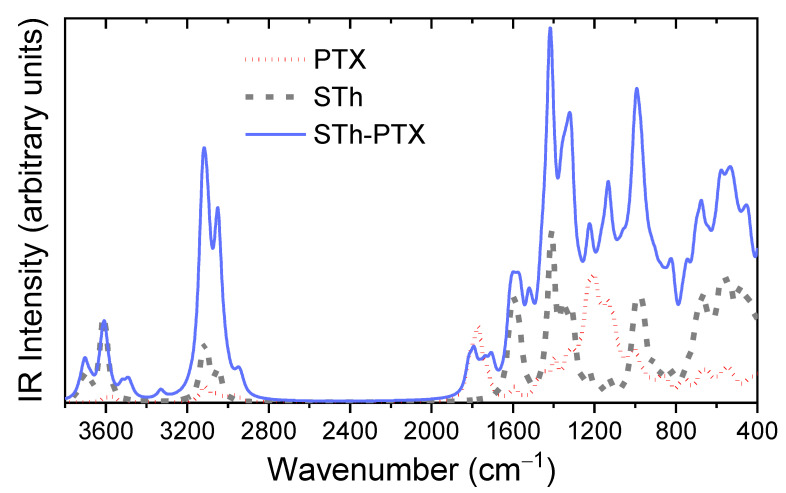
Figure 14.
Computed infrared (IR) spectrum of Taxol (PTX) shown by the red dotted line, the super tetrahedron (STh) shown by the gray dashed line, and the interacting super tetrahedron—Taxol system shown by the solid blue line. To be viewed in parallel to Figure 6. Computed at the GFN1-xTB level of theory.

