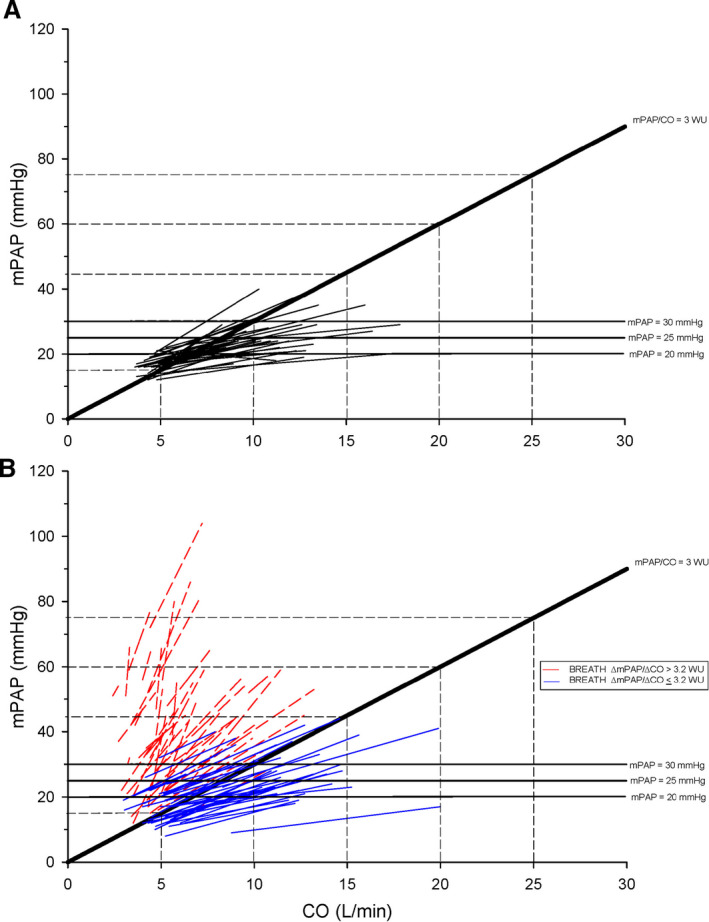
Figure 2. Individual total pulmonary resistance (TPR) slope from semiupright rest to steady state submaximal exercise.

A, Healthy control cohort. B, BREATH (Breathlessness Revealed Using Exercise to Assess the Hemodynamic Response) cohort. TPR slope of 3 WU is denoted within each panel. CO indicates cardiac output; and mPAP, mean pulmonary artery pressure.
