
Figure 3. Forest plots of pooled estimates for risk or protective factors of post–coronary artery bypass grafting acute cognitive decline.
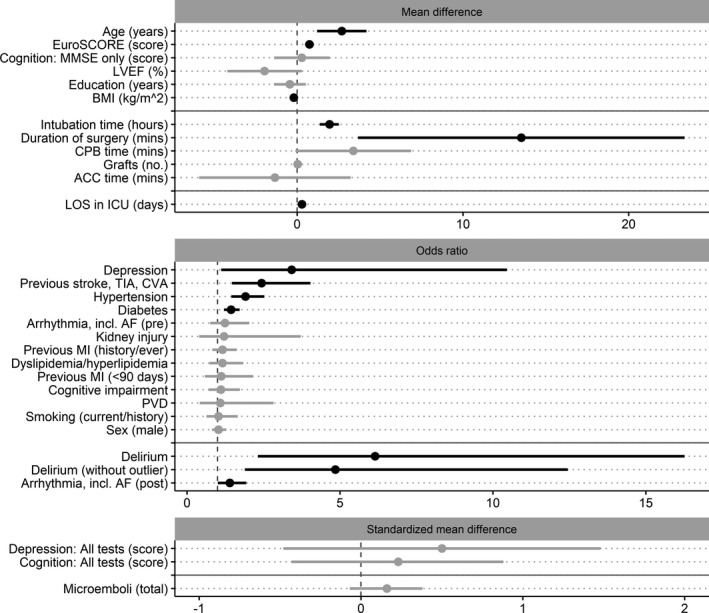
Factors grouped according to the primary pooled estimate of the analysis (mean difference [MD], odds ratio, or standardized MD [SMD]), where solid gray horizontal lines indicate separation of preoperative, intraoperative, and postoperative factors and dashed gray vertical lines divide protective (left side) and risk (right side) factor estimates. The pooled estimates are ordered by the common calculated effect size (SMD) from largest to smallest (largest at the top). Estimates that are black represent statistically significant factors; those that are gray did not reach statistical significance. The scale for all continuous variables (MD and SMD plots) is listed within each factor name. ACC indicates aortic cross‐clamp; AF, atrial fibrillation; BMI, body mass index; CPB, cardiopulmonary bypass; CVA, cerebrovascular attack; ICU, intensive care unit; LOS, length of stay; LVEF, left ventricular ejection fraction; MI, myocardial infarction; MMSE, Mini‐Mental State Examination; PVD, peripheral vascular disease; and TIA, transient ischemic attack.