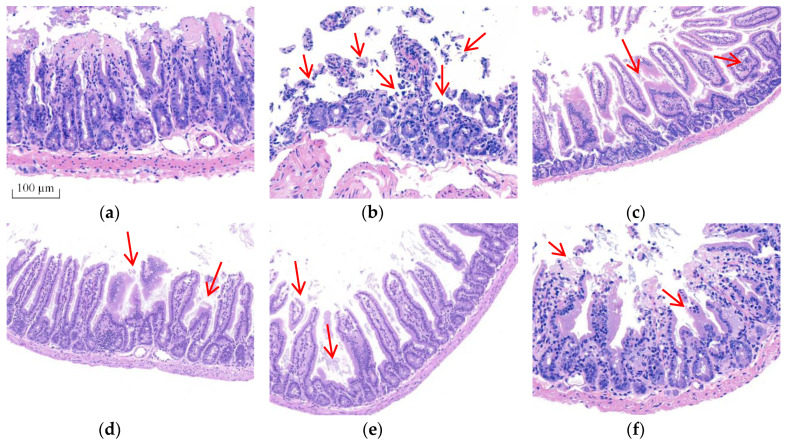
Figure 2.
Effect of BA on the morphological structure of the intestine in T-2 toxin-treated mice analyzed using H&E staining. Notes: (a), control group; (b), T-2 toxin group; (c), 0.25 mg/kg of BA group; (d), 0.5 mg/kg of BA group; (e), 1 mg/kg of BA group; (f), VE group. Red arrows show the breaking, loss and irregular arrangement of intestinal villi. Scale bar: 100 μm.

