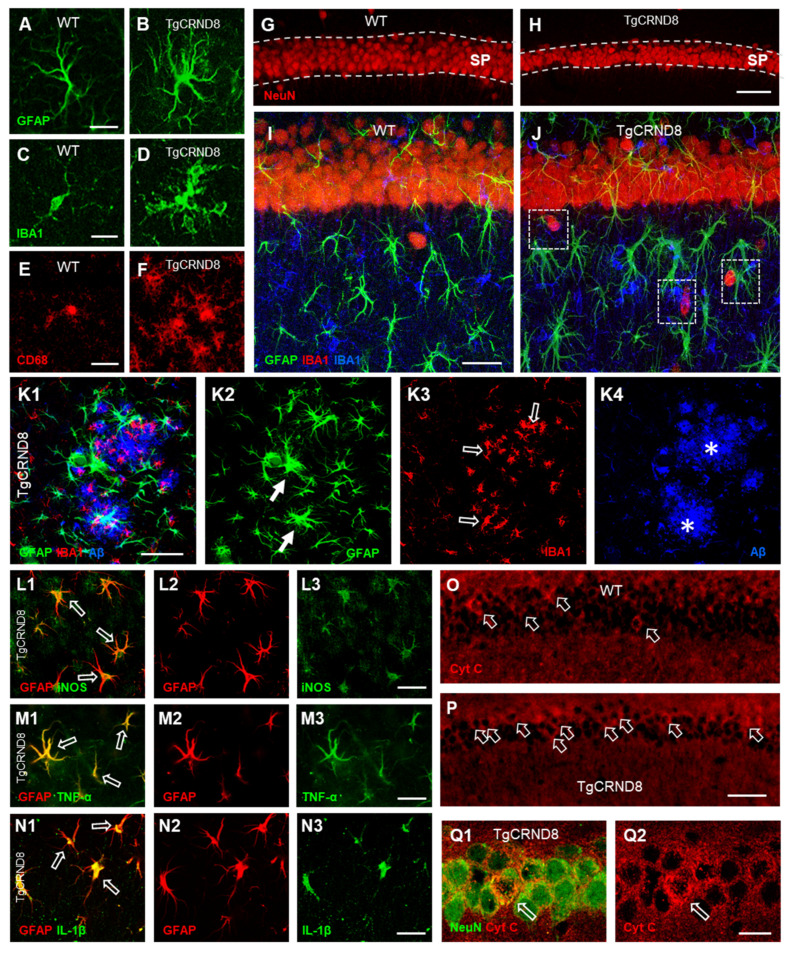
Figure 1.
(A,B) Representative confocal photomicrographs of GFAP immunostaining of an astrocyte (green) in CA1 SR of a WT (A) and a TgCRND8 mouse (B). Scale bar: 15 µm. (C,D): representative confocal photomicrographs of IBA1 immunostaining of microglia (green) in CA1 of a WT (C) and a TgCRND8 mouse (D). Scale bar: 20 µm. (E,F): Representative confocal photomicrographs of CD68 immunostaining of reactive microglia (red) in CA1 SR of a WT (E) and a TgCRND8 mouse (F). Scale bar: 20 µm. (G,H) Representative confocal photomicrographs of NeuN immunostaining of neurons (red) in CA1 SP of a WT (G) and a TgCRND8 mouse (H). Scale bar: 60 µm. (I,J) Representative confocal photomicrographs of triple immunostaining of neurons (NeuN, red), astrocytes (GFAP, green), and microglia (IBA1, blue) in the CA1 SR of a WT (I) and of TgCRND8 mouse (J). Neuron–astrocyte–microglia triads are evidenced in (J) (framed areas). Scale bar: 40 µm. (K1–K4): representative confocal photomicrographs of triple immunostaining of astrocytes ((K2), green, white arrows), microglia ((K3), red, open arrows), and amyloid beta (Aβ) plaques ((K4), blue, asterisks) in CA1 SR of a 6 months old TgCRND8 mouse. The merge is shown in panel (K1). Scale bar: 50 µm. (L1–L3) Double staining immunohistochemistry with anti iNOS ((L3), green) and anti GFAP ((L2), red) antibodies in CA1 SR of a TgCRND8 mouse. iNOS is colocalized in astrocytes ((L1), open arrows). Scale bar: 25 µm. (M1–M3) Double staining immunohistochemistry with anti TNF-α ((M3), green) and anti GFAP ((M2), red) antibodies in CA1 SR of a TgCRND8 mouse. TNF-α was colocalized in astrocytes ((M1), open arrows). Scale bar: 25 µm. (N1–N3) Double staining immunohistochemistry with anti IL-1β ((N3), green) and anti GFAP ((N2), red) antibodies in CA1 SR of a TgCRND8 mouse. IL-1β is colocalized in astrocytes ((N1), open arrows). Scale bar: 25 µm. (O,P): representative photomicrographs of Cyt C immunostaining of apoptotic neurons ((O,P) red) in CA1 SP of WT and a TgCRND8 mouse. The open arrows point to apoptotic neurons in CA1 SP. Scale bar: 100 µm. (Q1,Q2) Confocal magnification of Cyt C positive apoptotic neurons ((Q2), red, open arrow) in CA1 SP of a TgCRND8 mouse. Scale bar: 30 µm. (Modified from [37]).

