
Figure 2. Systolic blood pressure (SBP) and diastolic blood pressure (DBP) levels are normalized during long‐term fasting.
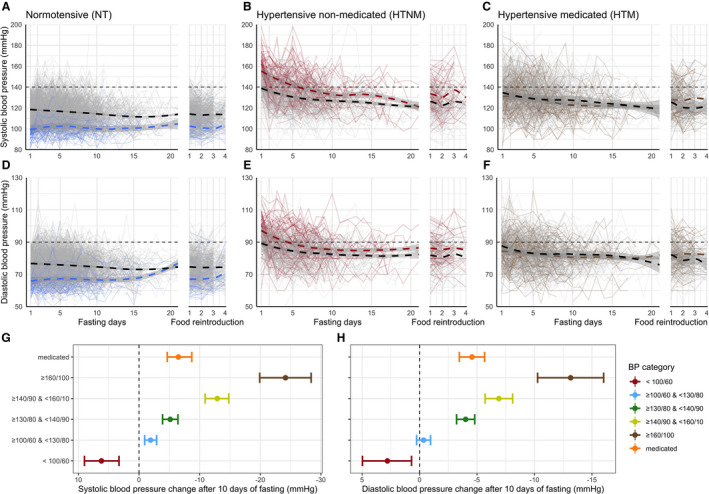
The blood pressure (BP) in normal (A, SBP; D, DBP), hypertensive (B, SBP; E, DBP), and medicated subjects (C, SBP; F, DBP) is presented during the first 20 days of fast and the consecutive refeeding. Individual changes in BP are displayed as gray lines. Smoothed conditional means are plotted as dashed lines to illustrate global trends. A color code is used to highlight subgroups consisting of 74 subjects with low BP (<100/60 mm Hg; in blue in A and D), 76 subjects with high BP (>160/100 mm Hg; in red in B and E), as well as 89 subjects who stopped their antihypertensive treatment (in brown in C and F). We also provided a summary of the changes in BP amplitude for SBP after 10 days of fasting (G) and DBP (H). Sex‐specific changes in BP are presented in supplementary material Figure S2 (men) and Figure S3 (women).