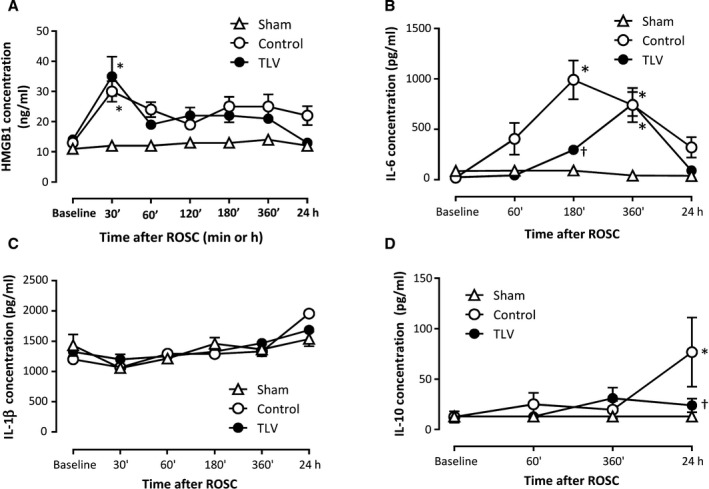
Figure 2. Early release of tissular damage and inflammatory markers in the different groups.

Blood concentrations of high‐mobility group box 1 (HMGB1; A), interleukin‐6 (B), interleukin‐1β (C), and interleukin‐10 (D) throughout the procedure, (n=5, 6 and 6 in sham, control, and TLV groups, respectively). Data are expressed as mean±SEM. Statistical comparisons were only made between groups but not among different time points; *P<0.05 vs corresponding sham; † P<0.05 vs corresponding control. ROSC indicates resumption of spontaneous circulation; and TLV, total liquid ventilation.
