
Figure 3. Neurological dysfunction score and histopathological morphology.
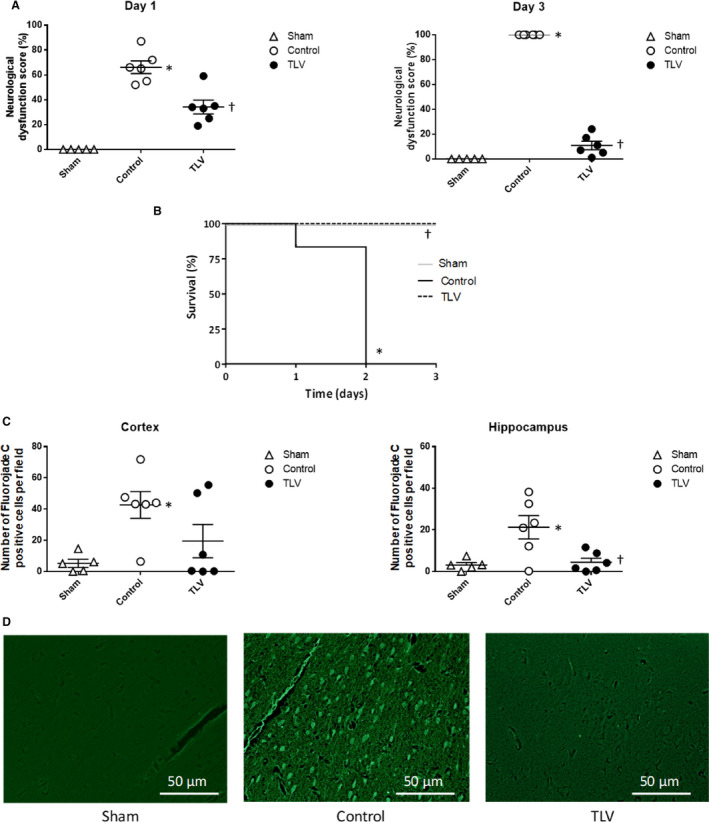
A, Neurological dysfunction at days 1 and 3 following resuscitation in the different experimental groups (0%=lack of dysfunction; 100%=death). Circles represent individual values. Lines represent mean values and corresponding standard error of the mean. B, Kaplan–Meyer survival curves. All premature death in the control group are related to anticipated euthanasia for ethical considerations. C, Number of degenerating neurons per field, as defined by positive Fluorojade C cells. Numbers are expressed as mean number per analyzed field, in parasagittal cortex and hippocampus. Numbers are mean values from 5 field per rabbit and area. D, Typical histological appearance of the cortex after Fluorojade C staining, showing no or few degenerating neurons in sham and TLV groups, as compared with frequent degenerating neurons in the control group. Data are expressed as mean±SEM. *P<0.05 vs corresponding sham; † P<0.05 vs corresponding control. TLV indicates total liquid ventilation; n=5, 6, and 6 in sham, control, and TLV groups, respectively.