
Figure 4. Conceptual rendition of the relationship of laboratory‐measured low‐density lipoprotein cholesterol (LDL‐C) in several scenarios of differing lipoprotein(a) (Lp[a]) mass levels. The true LDL‐C will vary significantly according to the Lp(a)‐cholesterol contribution, and cannot be ascertained from current laboratory methods.
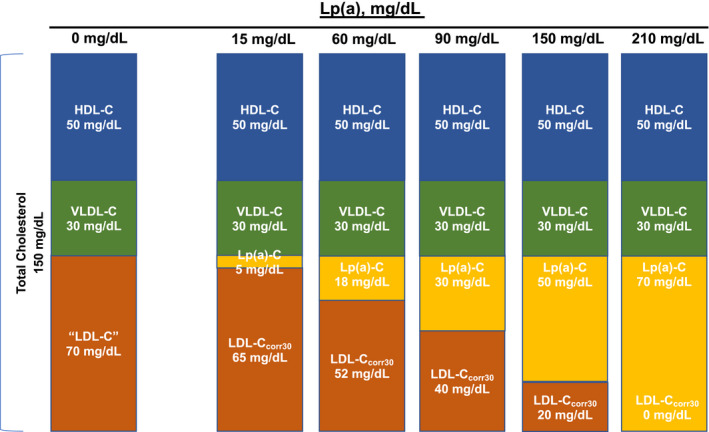
The traditional fasting lipid profile in a patient is shown in the left with total cholesterol of 150 mg/dL, composed of high‐density lipoprotein cholesterol (HDL‐C) 50 mg/dL, very LDL‐C (VLDL‐C) 30 mg/dL, “LDL‐C” 70 mg/dL, and Lp(a) mass 0 mg/dL, and thus Lp(a)‐C 0 mg/dL. As the Lp(a) mass increases, the Lp(a)‐C increases proportionally, and the estimated LDL‐C is also reduced. In the extreme, in a patient with Lp(a) mass of 210 mg/dL, the laboratory‐measured LDL‐C would be recorded as 70 mg/dL because of inability of current assays to differentiate between LDL‐C and Lp(a)‐C, but the true LDL‐C is closer to 0 mg/dL. This illustration assumes intermediate‐density lipoprotein cholesterol is 0 in the fasting state.