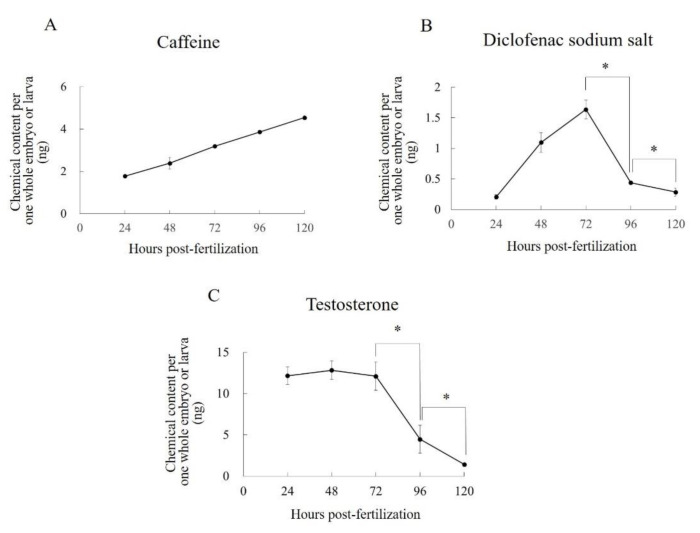
Figure 5.
Contents of (A) caffeine, (B) diclofenac sodium salt, and (C) testosterone per one whole embryo/larva during exposure to each test compound. Each plot shows the mean values of three replicates. Each error bar shows the standard deviation of the replicates. Significant differences between two specific data points, as determined by a two-tailed t-test, are shown by an asterisk (p < 0.05). Statistical analyses were performed only for the specific sets of data points shown by the asterisks.

