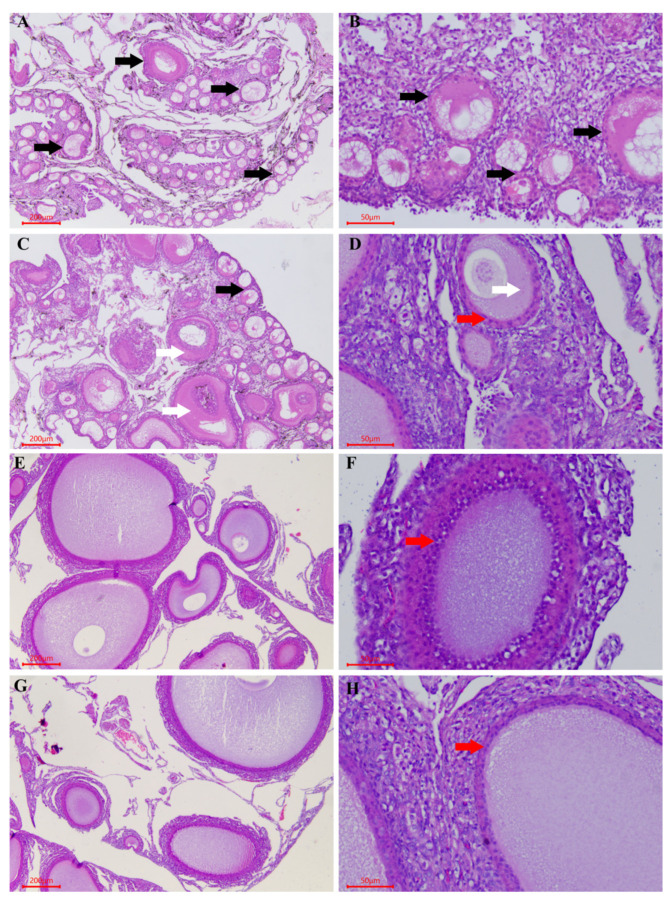
Figure 4.
Histological analysis of the chicken ovary at different ages. d90 ((A) 40×, (B) 200×), d125 ((C) 40×, (D) 200×), d139 ((E) 40×, (F) 200×), and d153 ((G) 40×, (H) 200×). The black arrow indicates the “primordial follicles”, the red arrow indicates the “granulosa cells”, and the white arrow indicates the “lipoproteins”.

