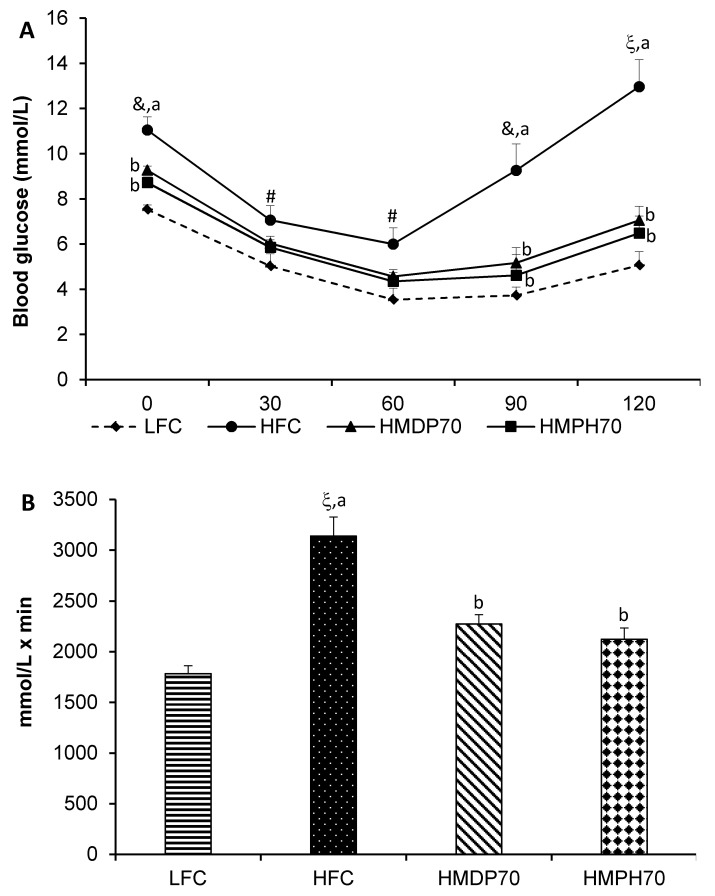
Figure 6.
Effect of HMDP and HMPH on insulin tolerance during week 7 of the treatment in mice fed a high-fat diet. Data are presented as means ± SEM (n = 6). (A) The results of insulin tolerance test. (B) The area under the curve (AUC) of the insulin tolerance test. The difference between the HFC and LFC groups was analyzed using repeated measures t-test (A) or Student’s t-test (B). The treatment effect was analyzed using repeated measures 1-way ANOVA (A) or 1-way ANOVA (B), and differences among the HFC, HMDP70 and HMPH70 groups were determined using the least-squares means test. The significance level was set to 0.05. # p < 0.05, & p < 0.01, ξ p < 0.0001 compared to LFC. a,b Among the HFC, HMDP70 and HMPH70 groups, values bearing different letters differ, p < 0.05. LFC, low-fat control diet; HFC, high-fat control diet; HMDP70, HFC diet with 70% of casein protein being replaced by the same amount of protein from herring milt dry powder; HMPH70, HFC diet with 70% of casein protein being replaced by the same amount of protein from herring milt protein hydrolysate.

