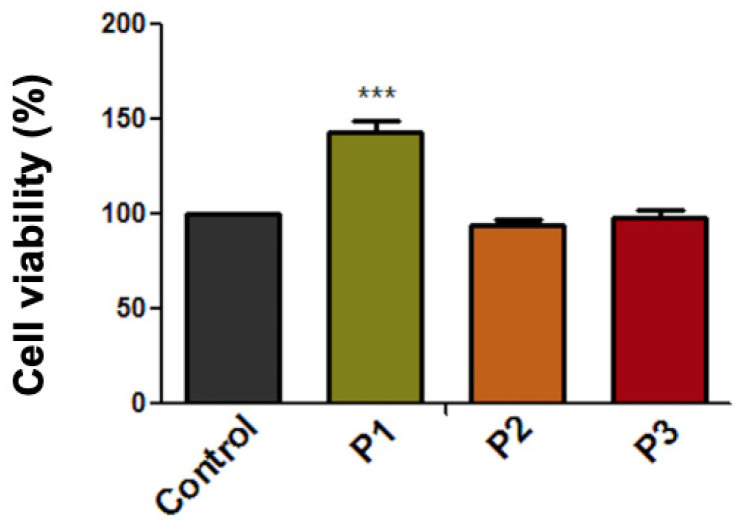
Figure 4.
Cell viability percentage of primary human gingival fibroblasts (HGFs) cells at 24 h post-treatment with extraction medium of test orthodontic implants (P1, P2, P3). Data are presented as cell viability percentage (%) normalized to control cells. The results represent the mean values ± SD of three separate experiments. One-way analysis of variance (ANOVA) test was performed to determine the statistical differences followed by Tukey’s multiple comparisons analysis (*** p < 0.001).

