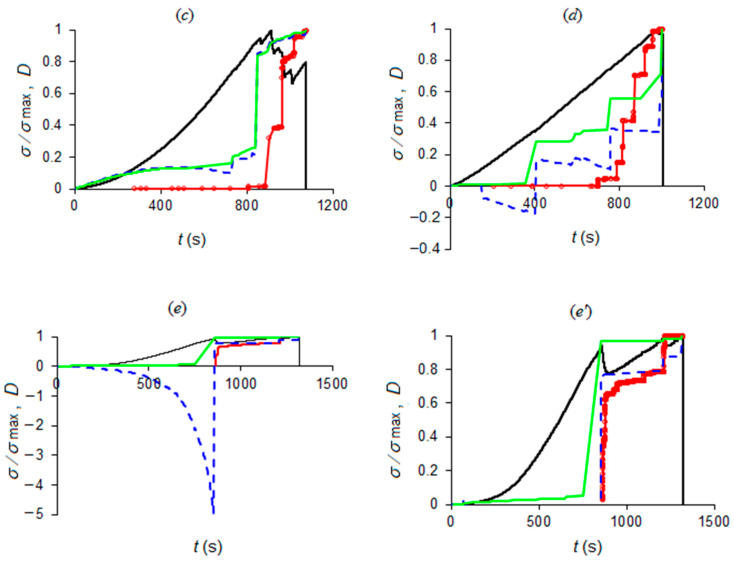
Figure 4.
Normalized applied stress (black line) and damage evolution in terms of acoustic emissions (dotted red line); electrical resistance (dashed blue line); and crack surface advancements by indirect measurement (light green line). The diagrams refer to the specimens corresponding to the data presented in (a–e) (see inset table of Figure 3). The last picture (e’) is a detail of the positive half-plane (damage ): negative values are due to temporary decrements in the electrical resistance of Luserna specimen (e).


