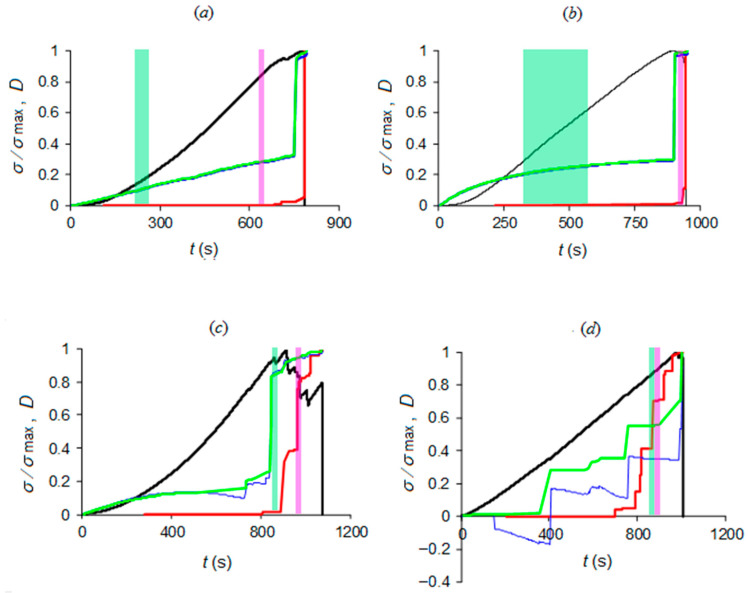
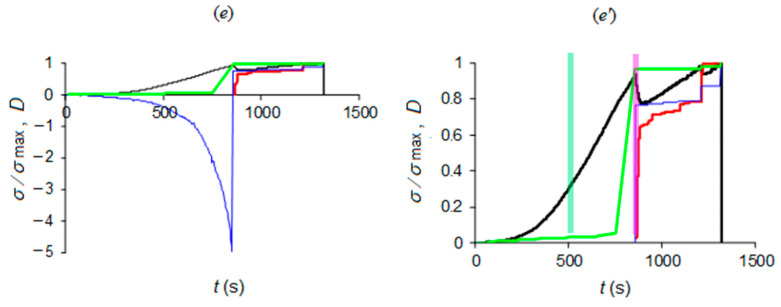
Figure 7.
Times of approach to criticality by NT analysis (identified by magenta patch for AE and light green patch for electrical resistance) correlated to load history and damage evolution: the diagrams refer to CM specimens (a,b) and LS specimens (c–e) according to the inset table of Figure 3; last picture (e’) magnifies the positive damage range of (e).


