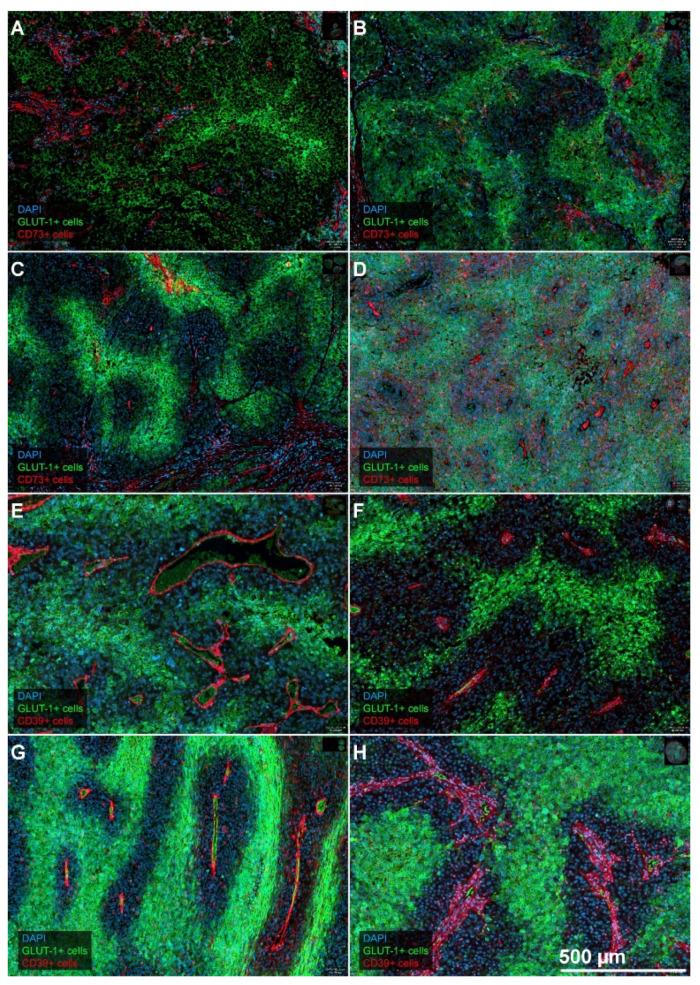
Figure 1.
Representative examples for the combined expression patterns of GLUT-1 and CD73, and CD39. Examples from eight different patients (A): LN-metastasis; (B): LN-metastasis; (C): LN-metastasis; (D): Lung-metastasis; (E): Brain-metastasis; (F): Skin-metastasis; (G): LN-metastasis; (H): Skin-metastasis) showing the combination of GLUT-1 expression and CD73, panels A to D, or the combination of GLUT-1 and CD39, panels E to H. Both CD73 and CD39 are mainly expressed in the stroma and stromal microvessels. Expression in tumor cells is sometimes present as well, e.g., for CD73 in panel (D). GLUT-1 shows a “hypoxia-related” expression pattern since the expression is most pronounced at the greatest distances from adjacent intratumoral microvessels. In some tumors, the transition is quite abrupt (e.g., B,C,F,G,H), while it can be more gradual in others (A,D,E). Magnification, 10 ×. Scale bar in H applies to all panels of the figure.

