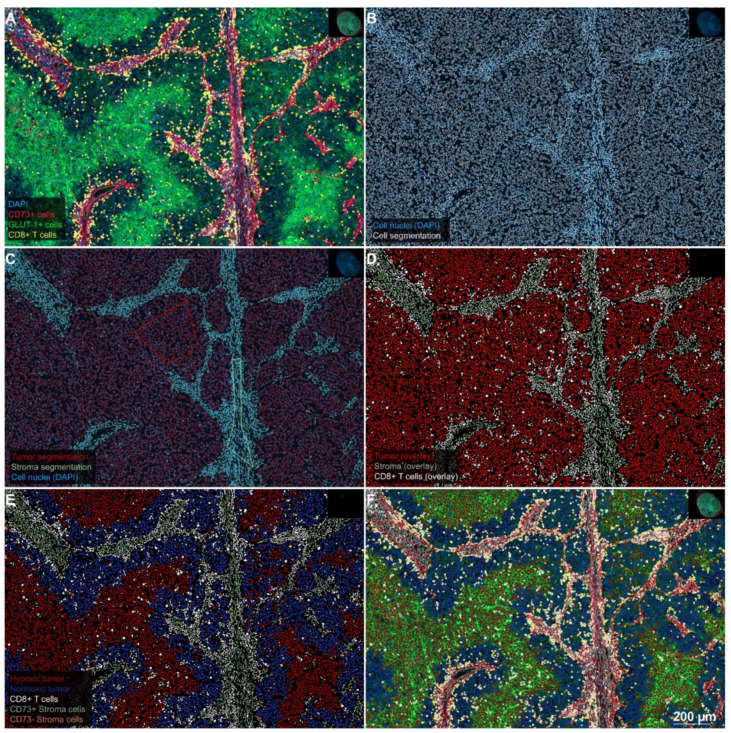
Figure 4.
Stepwise procedure for the analysis of the number and spatial context of CD8-positive CTL in the hypoxic melanoma microenvironment. (A) Original scanned 4-plex-immunofluorescence image. A representative region of interest (5×) extracted from the whole-slide specimen of a patient’s lymph node metastasis demonstrates a heterogeneous staining pattern for GLUT-1 (FITC-channel, green), which reflects the diffusion-limited availability of oxygen in the melanoma microenvironment. The expression of CD73 (Alexa-647-channel, red) is largely limited to the stroma and the endothelium of tumor microvessels. CD8-positive CTL (Cy3-channel, yellow) show a strong clustering in the stroma, whereas the infiltration of CTL into GLUT-1high tumor cell areas is sparse. Hence, the spatial distribution of CTL in this figure represents an example of an excluded infiltrate. DAPI counterstain (blue) was used for segmentation of cell nuclei. (B) Single-cell-based analyses were carried out using segmented nuclei (white border) as the starting point for cell detection in the open-source software QuPath. This approach enabled the systematic subclassification of all cell events. First, we subclassified cells as “tumor” or “stroma” using QuPath’s machine learning features and user-defined examples (C); tumor cells with a red border; stroma cells with an olive green border). Second, we further subclassified cells using intensity-thresholds in the relevant fluorescence channels in a sequential procedure, color-coding CTL with a white overlay based on the intensity in the Cy3 channel (D). Next, tumor cells (red overlay in D) were further subclassified into GLUT-1high and GLUT-1low (i.e., presumably hypoxic and normoxic) tumor cells with a red and blue overlay, respectively (E), based on thresholding in the FITC-channel. Finally, stroma cells (olive green overlay in D) were subclassified into CD73-positive and CD73-negative stroma cells, based on the intensity in the Alexa 647-channel (olive green and orange overlay, respectively as shown in E). Merging of the original 4-plex-IF-image (A) with the classification overlay (E), as shown in panel (F), illustrates the final result of this sequential approach. Despite a relatively dense immune infiltrate, this patient showed an overall survival of only ten months.

