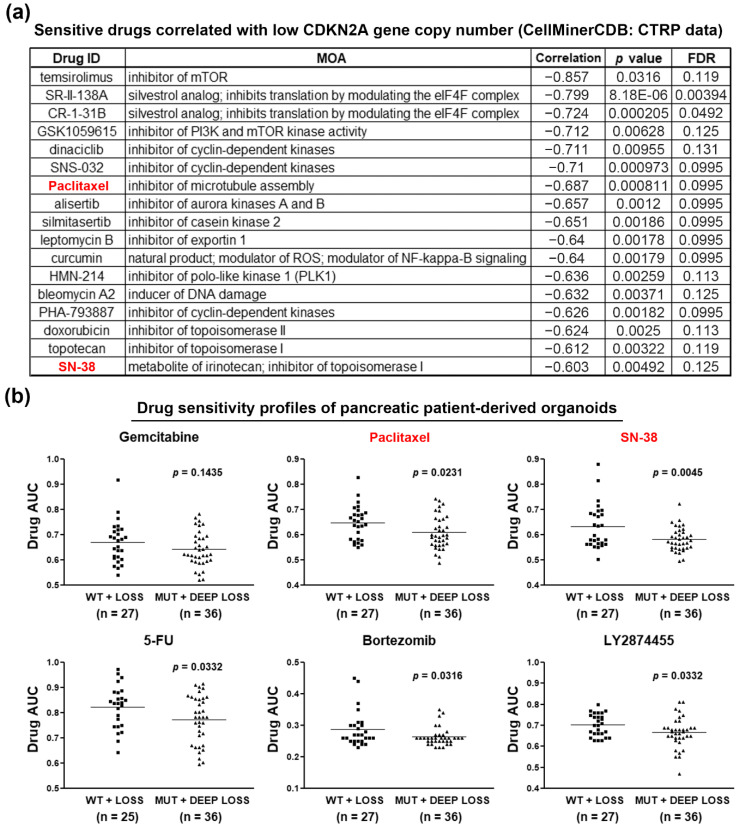
Figure 3.
Chemosensitivity profiles in CDKN2A-inactivated PDAC cell lines and patient-derived organoids. (a) The correlation between CDKN2A gene copy numbers and drug sensitivities in PDAC cell lines were obtained from the CTRP data via the CellMinerCDB website. Sensitive drugs correlated with low CDKN2A gene copy numbers are shown; (b) drug response data in PDAC patient-derived organoids were obtained from the supplementary materials in a previous study (reference [23]). Lower area under the curve (AUC) values indicated that the organoids were more sensitive to drug treatment.

