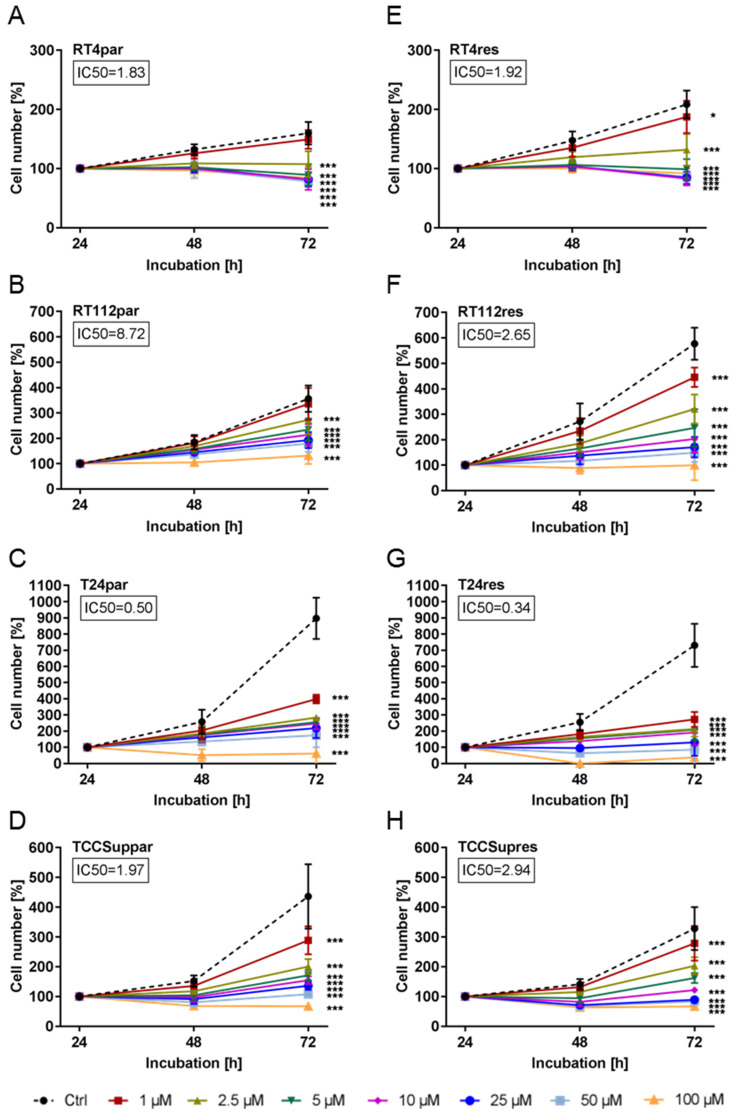
Figure 1.
Tumor cell growth: Tumor cell growth (MTT-test) of parental (par) and cisplatin-resistant (res) RT4 (A,E), RT112 (B,F), T24 (C,G), and TCCSup (D,H) bladder cancer cells after 24, 48, and 72 h treatment with ascending concentrations of ART (1–100 µM). Cell number set to 100% after 24 h incubation. The half-maximal inhibitory concentration (IC50) of ART in µM after 72 h treatment is specified. Error bars indicate standard deviation (SD). Significant difference to untreated control: * p ≤ 0.05, *** p ≤ 0.001. n = 5.

